Search the Community
Showing results for tags 'ENVI'.
-
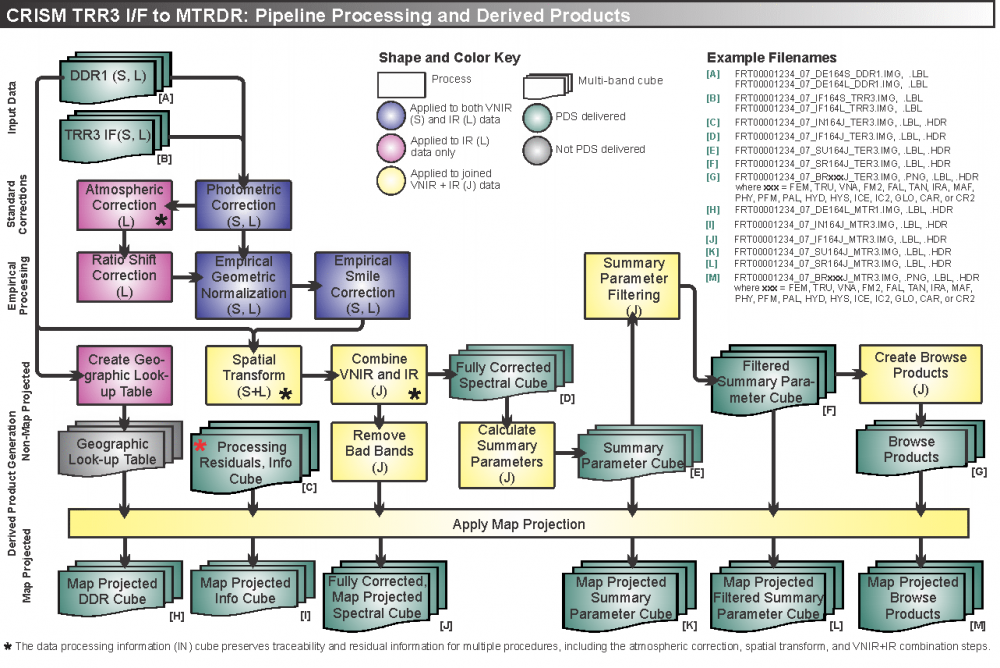
Hi, I understand that using CAT ENVI tool we can do ATP correction to an CRISM image by selecting a single image file each time. However, I need to use ATP correction for thousands of CRISM images. Just wondering if there is any way I can run batch ATP process multiple images without needing to select a single image at each time? Thank you, Emran
- 2 replies
-
- crism
- crism data analysis
-
(and 4 more)
Tagged with:
-
hirise Open HiRISE on ENVI 5.6+ together with CRISM
Nathan Weinstein posted a topic in For data users
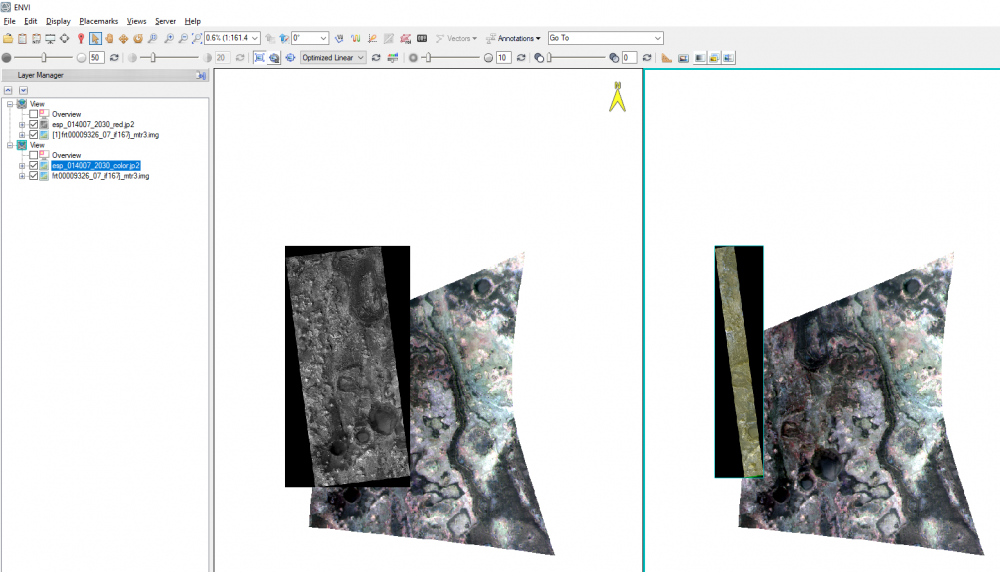
Hello, How to correctly open and overlay map-projected HiRISE and CRISM products? I know that they both should have the same projection (with different pixel size/map scale/spatial resolution). But, unexpectedly they opened from the first pixel's location of the first opened raster layer and not accordingly and independently by the map coordinates of each rasters. See attached. Thanks, Nathan -
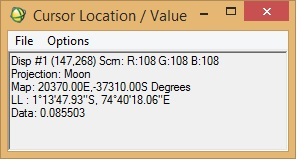
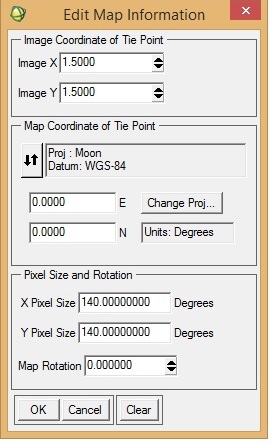
I want to georeference an M3 image (obtained via PDS) in ENVI. I was following "Assigning Map Information to PDS Images in ENVI", posted by Dr June Wang. I was able to perform most of the steps. Yet when the process is complete, it seems that the georeferencing is not correct. I have attached a couple of screenshots from the M3 image I was working with. To check the accuracy of georeferencing, I cross-checked the location from Google Moon and found that there are a lot of discrepancies between the 'georeferenced' M3 image and Google Moon. In the 'Edit Map Information' window, I entered X-pixel and Y-pixel sizes as 140. Please let me know if this is correct. When I cross-checked with Google Moon, the top of the image should have latitude as north and the bottom the image as south (also verified from LOC file of the M3 image). Please help.
-
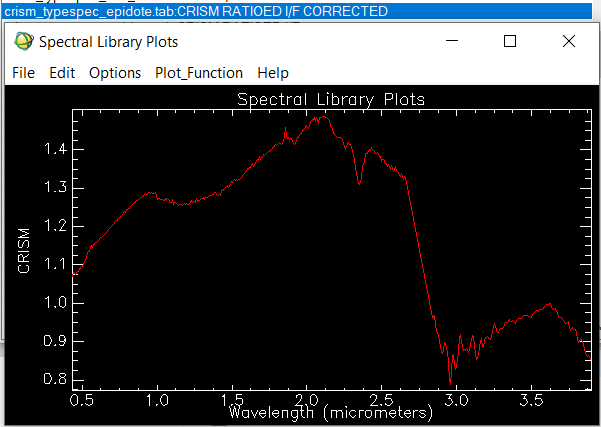
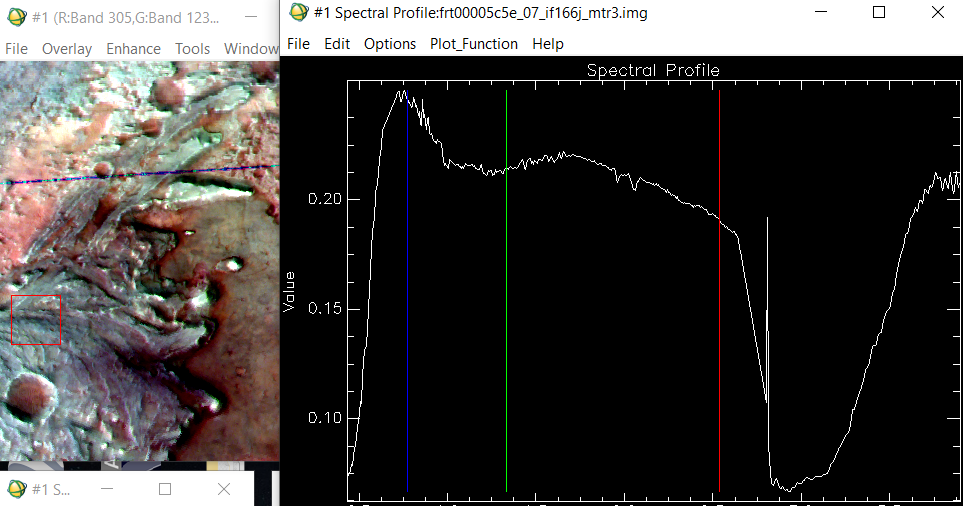
Good afternoon. I'm an undergraduate student of geomatics and remote sensing, and I was trying to use the CRISM images to classify minerals and chemical compounds on the surface of Mars. I collected some information about all the products to use, also I followed the workflow proposed here and I installed CAT on ENVI. I was trying to use a an image of the Jezero Crater data product: frt00005c5e_07_if166j_mtr3, which is projected, atmosferically and geometrically corrected. The data is on I/F which as is explained here, on the FAQs means: Q: What does I/F stand for? A: CRISM is a reflectance spectrometer, and I/F is how reflectance is represented algebraically: I is the energy (actually radiance) observed by the CRISM instrument, and F is the energy (actually solar irradiance) incident at the top of the Martian atmosphere. I/F is a ratio of energies (radiance/irradiance), with some additional scaling so the ratio is unitless. Acording to my knowledge radiance/irradiance=reflectance (unitless), maybe I'm wrong. The case is that I tried to classify the minerals on the image of the Jezero Crater using this library from Viviano et al using the "CRISM RATIOED I/F CORRECTED" spectra but I get wrong or absurd results. I noticed that the spectra of my images is clearly different from the spectra that I find on the Viviano library ratioed i/f. My Spectra always follow this pattern, and never reaches a reflectance of 0.5. Nevertheless on the Viviano library I found spectra like this one of epidote: Why the spectra of my image is so different? Is my data really on reflectance? How can I get real reflectances?
- 14 replies
-
- envi
- spectral library
-
(and 2 more)
Tagged with:
-
Hi, I am working with CRISM data on the McLaughlin Crater . I have downloaded following IR dataset images FRT0000CB488_07_IF166L_TRR3 FRT000139F7_07_IF166L_TRR3 FRT000247A0_07_IF166L_TRR3 HRS00006AC4_07_IF175L_TRR3 FRS00029E22_01_IF168L_TRR3 FRS0002B4DA_01_IF168L_TRR3 FRS0002C9DC_01_IF168L_TRR3 FRS0002DB50_01_IF168L_TRR3 FRS0002EF79_01_IF168L_TRR3 FRS0002FF3C_01_IF168L_TRR3 FRS0003134A_01_IF168L_TRR3 FRS00035729_01_IF168L_TRR3 FRS0003640C_01_IF168L_TRR3 FRS0003705A_01_IF168L_TRR3 FRT00009CAE_07_IF166L_TRR3 FRT0000A27C_07_IF166L_TRR3 FRT0000A5AA_07_IF166L_TRR3 FRT0000C42E_07_IF166L_TRR3 FRT0000C6AF_07_IF166L_TRR3 as well as those VNIR images: hsv0001bf65_01_if209s_trr3 hsv0001e87c_01_if209s_trr3 hsv0002e57c_01_if209s_trr3 hsv0003f9e0_01_if209s_trr3 hsv00043b25_07_if209s_trr3 hsv000293cf_01_if209s_trr3 hsv000412d4_03_if209s_trr3 hsv000478c2_03_if209s_trr3 hsv0002003a_01_if209s_trr3 hsv0002246d_03_if209s_trr3 hsv0003793e_01_if209s_trr3 What would be the steps needed to process those images? As far as I understood I need to 1) Convert PDS to CAT ( is it needed ? ) before loading image into Envi 1) ATM correction ( for VNIR images only photometric correction) 2) CIRRUS ( despike + destripe) 3) MRO CRISM remove stripes 4) Flatten summary products ( what does it do ? is it necessary ? ) 5) Apply crism bad band list Are the above steps correct/enough/in the correct order , and is there a script ( IDL whatever ) to process thos images as a batch task ? I am doing a geological map of the McLaughlin crater, using crism's "rock.sli" spectral library to map the geological units. Can this library be used with VNIR data, or only with IR data ? Thanks Ralph Vidal
-
Hello My name is Vidyesh Sathe, I am actually working on my Dissertation in Planetary Geology, I am pretty new to Crism Data Set and Analysis of Crism Data. I am using Data set which is frt0001176e_07_if164ds_trr3.img and frt0001176e_07_if164l_trr3.img, i am using both VNIR And IR data. sir I followed the process given in CRISM Demonstration: Data Access, Processing, and Analysis - 3rd Planetary Data Workshop 2012, After pre-processing given in presentation, I wanted to Combine both VNIR and IR data. so i followed standard Envi process which is, Envi-Basic Tool-Layer stacking I imported both map-projected images of VNIR(S) and IR(L). But as the result the image was completely Black but the information was present(Spectra information from 0.5-3.9) I will be really grateful if you can explain to me what i am doing wrong, and what should I do to correctly project the image. Thank You.
- 3 replies
-
- crism
- crism data analysis
-
(and 1 more)
Tagged with:
-
Hi community, I'm working with ENVI 5.3 + IDL coupled with CAT 7.4 trying to process TRDR images (.trr3). I'm based primarly on the CRISM data processing workshop from 2012 and 2017 and my worksteps are as follows: 1.- Apply the ATM corrections with CAT to the images 2.- Apply de map projection fo the image 3.- Obtain the summary parameters image Nevertheless, I have certain doubts about this, so I would be very grateful if you can provide me some help please. My questions are: - Should I obtain the summary parameters and then apply the map projection or it is the opposite? - It is necessary the "ratioing" for the spectra and use the "Flatten summary parameters" option?. I've seen a post where its says that is enough the "Continuum Removed" option - How can i obtain a better resolution for the summary parameters image?. I've seen very good resolution images from papers that doesn't look like what I have obtaining (img_1) - When I create the summary parameters image the spectra doesn't look like the TRDR pure image because the data values change. Does that mean that I have to use the spectra from the TRDR and the summary parameters image is just like a "color guide" fot the mineral phases? (img_2) Finally, how can I use the summary parameters properly and elaborate mineralogical maps from they? Any help will be very appreciated, thank you. Wladimir wladimiracevedo@udec.cl img_1: The resolution that I'm getting from the summary parameters image after the custom stretch img_2: Spectra for the summary parameters image vs the original TRDR corrected image from the same pixel on both.
-
A new version of OMEGA Analysis Tool (OAT) for ENVI, version 1.0.2, is now available. OAT is a collection of ENVI and IDL procedures for reading, displaying, and analyzing OMEGA data, based on the OMEGA team's SOFT10 code. It supports ENVI 5.4+. Currently, installation instructions are only available for Windows. OAT can be downloaded from the Online Tools section of this page.
-
Note for ENVI users of map-projected data: Some Geosciences Node hosted map-projected data sets (.IMG files) are not read by ENVI as projected data sets. Using the Geospatial Data Abstraction Library (GDAL) gdal_translate command, users can easily convert most of these data products into GeoTIFF or ENVI file formats which are read by ENVI as projected data. GDAL packages for various computer systems can be found here: https://trac.osgeo.org/gdal/wiki/DownloadingGdalBinaries. The Windows package used in this example is the OSGEO4W 64-bit version. A MacOS X build is available, as well. Download and install a GDAL package that has gdal_translate.exe. gdal_translate.exe runs from the command line. Make the folder that contains gdal_translate.exe your current directoryTo do this, type "cd path" without the quotes into the command line, where "path" is the full path to the folder that contains gdal_translate.exe. gdal_translate.exe is executed with the following syntax: gdal_translate –of outputtype inputfilepath outputfilepath "outputtype" is GTiff for a GeoTiff (.tif) and ENVI for an ENVI file (.dat) Both file paths are the full path to the file. In the case of a file with a detached PDS label, the "inputfilepath" points to the label, not the data file. Open the file as normal in ENVI. Example using OSGeo4W 64-bit (Windows): C:\>cd OSGeo4W64\bin C:\OSGeo4W64\bin>gdal_translate -of GTiff C:\hrsc\h2064_0000_dt4.img C:\hrsc\h2064_0000_dt4.tif Example using GDAL 2.1 Complete (MacOS X): :/ cd Library/Frameworks/GDAL.framework/Programs :Programs ./gdal_translate -of ENVI /Desktop/hrsc/h2064_0000_dt4.img /Desktop/hrsc/h2064_0000_dt4.dat Examples of data sets that benefit from the GDAL translate command: MRO - HiRISE DTM Mars Express - all HRSC, OMEGA DDRGM Odyssey - THEMIS IRGEO2, VGEO1, VGEO2 MGS - MOLA MEGDR, TES TIMAP Additional instructions for specific data sets: Mars Odyssey THEMIS Visible map-projected .CUB files (VGEO1 and VGEO2) have detached PDS labels, but the map-projection data is in the .CUB file, so the "inputfilepath" should be the data file itself. Mars Odyssey THEMIS Infrared map-projected .CUB.gz files (IRGEO2) need to be un-zipped before using gdal_translate. These data are similar to the visible data files in "inputfilepath" syntax (.CUB, not .LBL). More details about the gdal_translate command can be found at http://www.gdal.org/gdal_translate.html.
- 2 replies
-
- ENVI
- Map Projection
-
(and 2 more)
Tagged with:
-
Hello, I installed CAT 7.3.1. in ENVI 5.4 as per the instruction. ENVI shows CAT tool neither in menubar nor under Display. An extension toolbox has created named ''cat_menu'' (see attachment). But, this icon doesn't work also! How can I fix this? Thank you,
-
Hi, I've come across many workshop presentation papers and research papers in which the processing of CRISM images include 'Spectral Smile Removal' and the entire sequence of Empirical Processing. 1. When we download the TRR3 data, is it already taken care of? Or do we have to follow a certain algorithm to manually apply it? Can you please suggest me how to do it? It is not mentioned in any workshop papers. 2. If we have to manually perform this task, do we have to do it via IDL/MATLAB programming or is it possible to do so in a GUI software (viz CAT, ENVI)? Thank You! Sourabh Shubham Department Of Geology and Geophysics IIT Kharagpur
- 1 reply
-
- crism data analysis
- spectral smile removal
-
(and 6 more)
Tagged with:
-
I wonder if anyone would have a good book recommendation for getting stuck into ENVI+IDL coding with a focus on this type of data? Has anyone self taught with a particularly useful book?
-
The CRISM Analysis Tool (CAT) is a collection of ENVI and IDL procedures for reading, displaying, and analyzing MRO CRISM data. CAT is now available for ENVI versions 4.x and 5.x, for both Unix and Windows systems. See details at http://pds-geosciences.wustl.edu/missions/mro/crism.htm#Tools.
-
Hello, I'm new to SHARAD data and facing problems viewing the 2D radargrams. I have tried to open them with NASAView but it is only showing me columns of numbers. I tried to open the images with ENVI but even with different combinations of header offset, columns and rows, I am not able to view the radargrams. The browse images are there, but to analyze the images I need to view them in ENVI. Could someone please tell me how I might be able to visualize the radargrams in ENVI? (A sample header file for a SHARAD rdr file would also be very helpful). Thank you! Ranjan
-
Dear All, As I am working in Planetary Sciences, I use hyperspectral imagery for analysis of spectral characteristics of minerals in extra - terrestrial body. I found that CAT_ENVI extension is useful for such analysis. I did download and tried to install as per the instruction found in http://pds-geosciences.wustl.edu/missions/mro/crism.htm I am using ENVI 4.7 with IDL 7.1 in Windows 7. I added command lines as per given in the user guide. There was no errors while i Installed. But I couldn't find the 'CAT_ENVI' tab in ENVI menu. Can anyone suggest me how to solve this issue. Many thanks in advance. Regards, Mahima.

.thumb.png.33b8f16d9db3d6a53d910500f2f02e46.png)

