Feng
-
Posts
53 -
Joined
-
Last visited
Content Type
Profiles
Forums
Downloads
Blogs
Everything posted by Feng
-
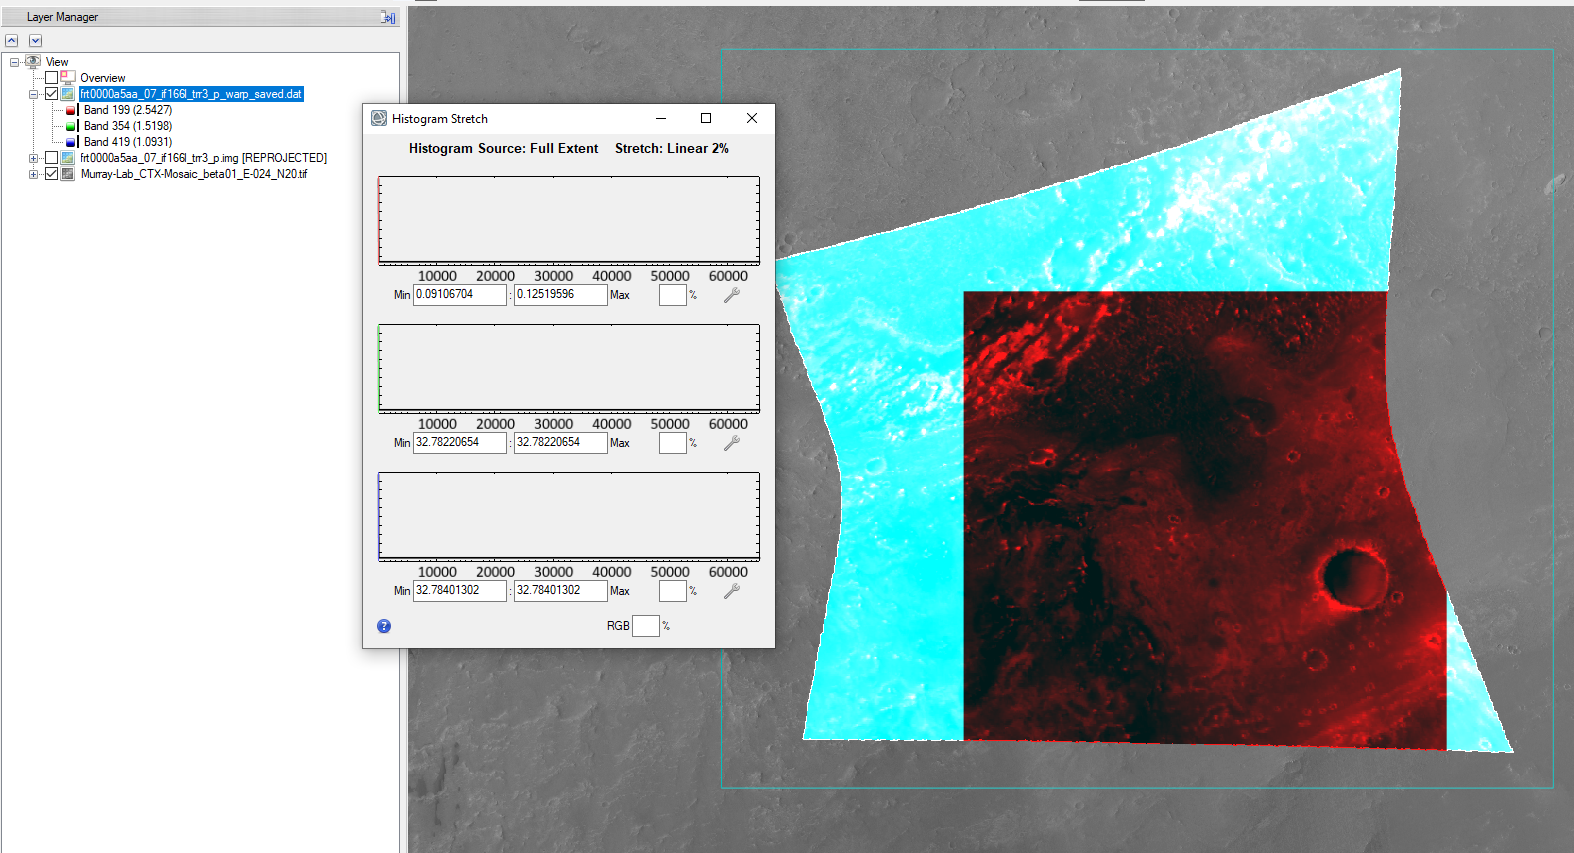
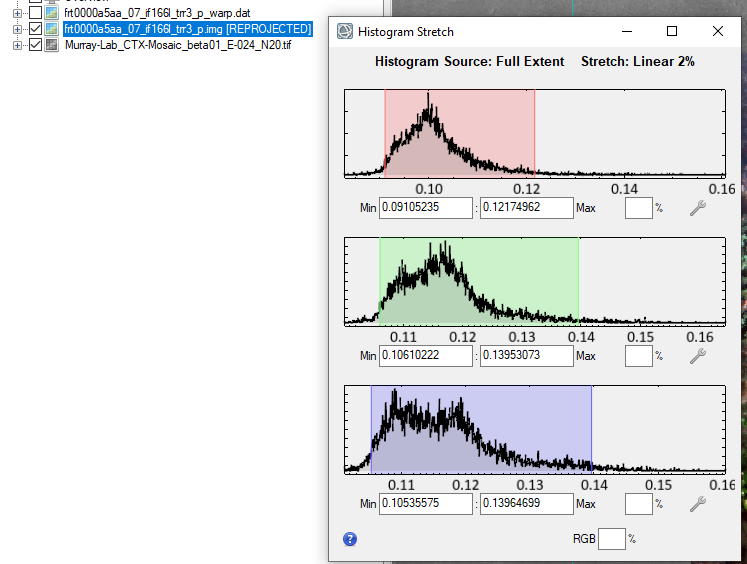
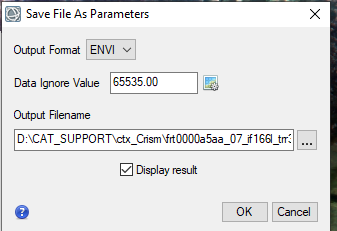
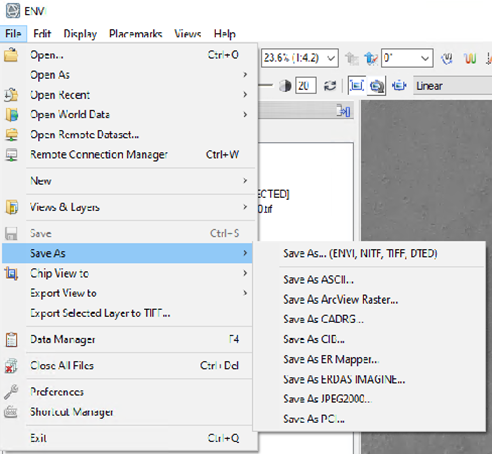
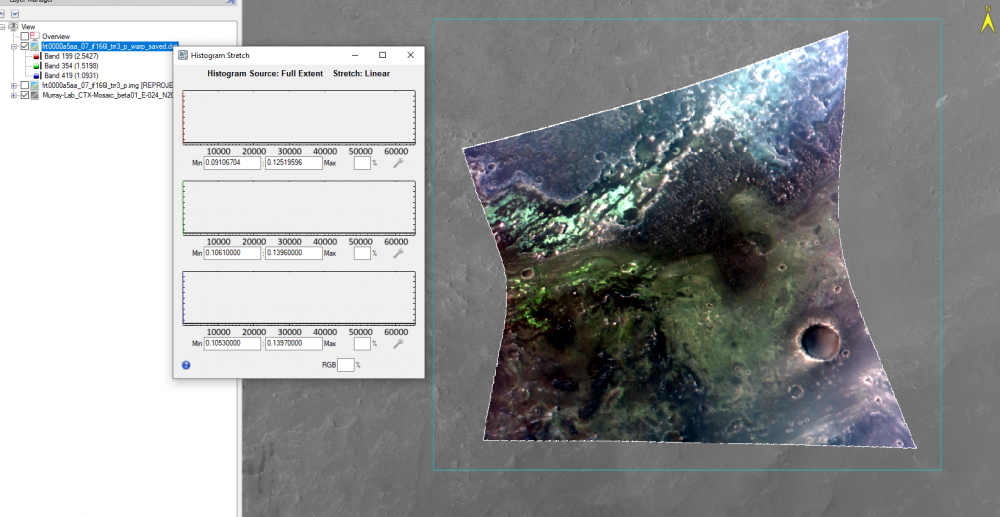
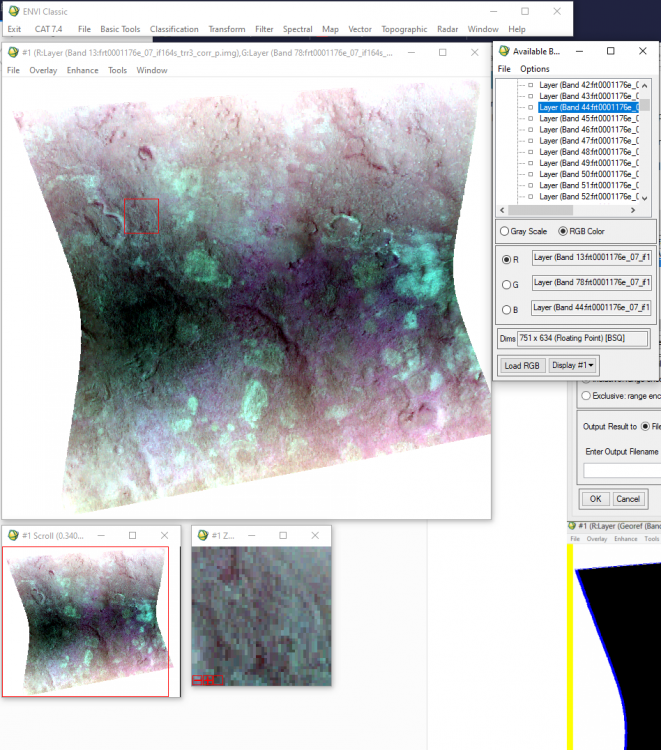
Hi Ralph, This is caused by ENVI displaying the CRISM 65535 data_ignore_value. The warp image is displaying the big span than the valid data range. To display it correctly, you can modify the histogram stretch. Here are the steps: 1, first check the histogram for three bands value range of the trr3: 2, use "save as" tool under File to output the warped result to specify the data ignore value: 3, then change the output image accordingly: From to: Please let me know if you have any questions. Thanks, Feng

-
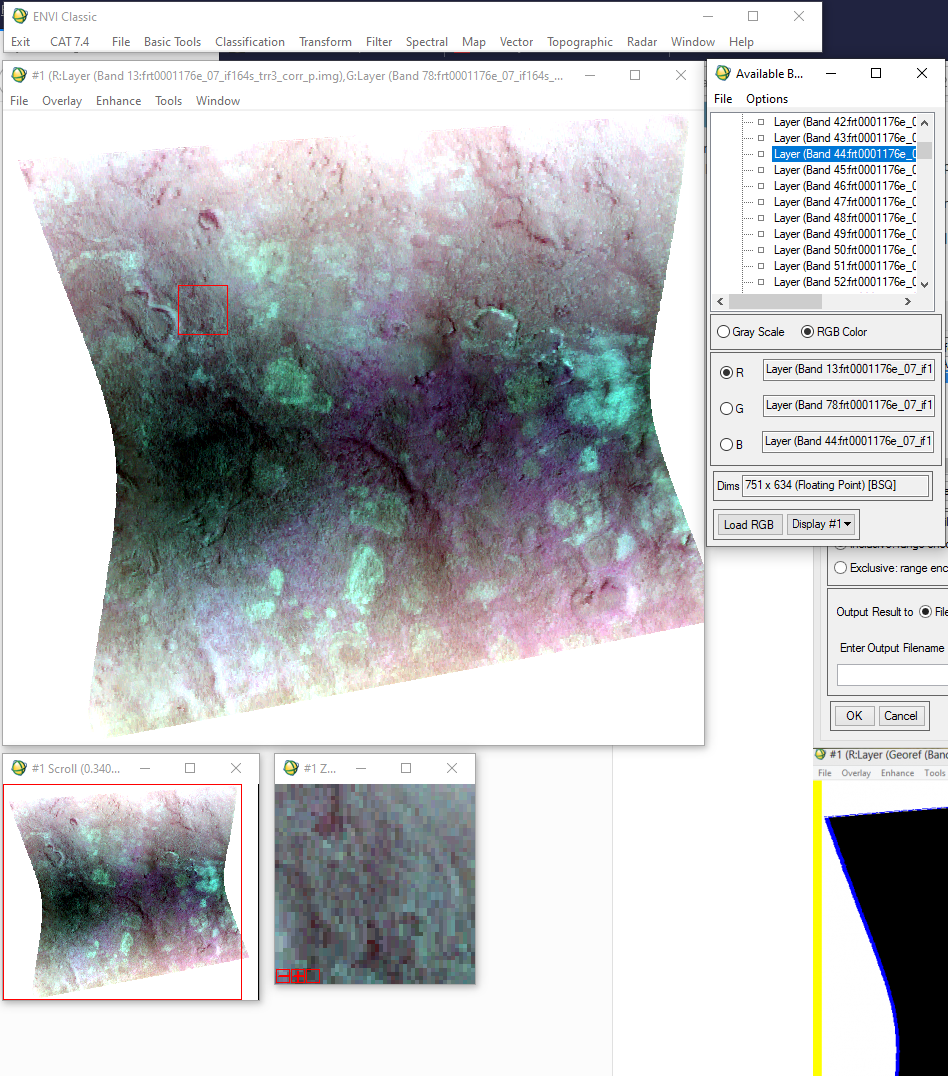
Hi Ralph, i saw the miss-match feature when overlapping CRISM on CTX even projecting them to the same map projection. This is because CTX and CRISM are from two instruments and processed differently. So you may use ENVI image registration to co-register CRISM to CTX to reduce the difference (see image registration workflow in ENVI: https://www.harrisgeospatial.com/docs/ImageRegistration.html). Please let me know if you have any question. Thanks, Feng
-
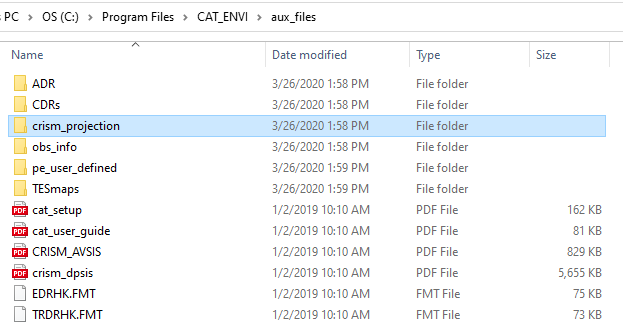
Hi Ralph, This is Feng. I will assistant you on this issue.These definitions are in CAT folder: CAT_ENVI -> aux_files -> crism_projection. These are three files in the folder. And you shall copy them to ENVI folder like: C:\Program Files\Harris\ENVI55\IDL87\resource\pedata\user_defined You can check CAT installation guide for more details: step 5 in https://pds-geosciences.wustl.edu/missions/mro/CAT_74_ENVI_5x_Setup_Windows.pdf Please let me know if you have any question. Thanks, Feng
-
Hi Vidyesh, A data ignore value is a designated pixel value that ENVI should ignore when processing an image or computing statistics. When CAT processing these image, it sets the noData as 65535. If the data ignore value is not set as 65535, when ENVI display these images, it displays the whole data range (i.e. from 0 to 65535). So the input histogram for each color (RGB) is from 0 to 65535, the output display will arrange them from 0 to 255. Since most values data are close to zero end not the 65535 end, it returns 0 (for each color i.e. RGB) on the output display instead of a value between 0 and 255. So ENVI now displayes a image which has R=0, G=0, B=0. which is actual a black image. Hope this helps. Thanks, Feng
-
Hi Vidyesh, I download these two data and processed the exact same way as you described but didn't find any problem. Your processing looks fine. One thing you may look at is the header file of the stacking image. The blank in your image could be the data_ignore_value in your header. Would you please compare the header file with mines: ENVI description = { Create Layer File Result [Tue Dec 17 09:47:59 2019]} samples = 751 lines = 634 bands = 518 header offset = 0 file type = ENVI Standard data type = 4 interleave = bsq sensor type = Unknown byte order = 0 map info = {MRO Mars Equirectangular [IAU 2000] [-35.00N; -39.88E], 1.0000, 1.0000, -6787.3851, -2187402.8323, 1.8000000000e+001, 1.8000000000e+001, D_Mars_2000_IAU_IAG_custom_sphere_lat35, units=Meters} projection info = {17, 3389570.0, -35.000000, -39.880000, 0.0, 0.0, D_Mars_2000_IAU_IAG_custom_sphere_lat35, MRO Mars Equirectangular [IAU 2000] [-35.00N; -39.88E], units=Meters} coordinate system string = {PROJCS["MRO Mars Equirectangular [IAU 2000] [-35.00N; -39.88E]",GEOGCS["GCS_Mars_2000_IAU_IAG_custom_sphere_lat35",DATUM["D_Mars_2000_IAU_IAG_custom_sphere_lat35",SPHEROID["Mars_2000_IAU_IAG_custom_sphere_lat35",3389570.0,0.0]],PRIMEM["Reference_Meridian",0.0],UNIT["Degree",0.0174532925199433]],PROJECTION["Equidistant_Cylindrical"],PARAMETER["False_Easting",0.0],PARAMETER["False_Northing",0.0],PARAMETER["Central_Meridian",-39.88],PARAMETER["Standard_Parallel_1",-35.0],UNIT["Meter",1.0]]} wavelength units = Nanometers data ignore value = 6.55350000e+004 band names = { Layer (Band 1:frt0001176e_07_if164s_trr3_corr_p.img), Layer (Band 2:frt0001176e_07_if164s_trr3_corr_p.img), ..... Also I am using CAT 7.4 in ENVI 5.5 standard (not classic version) to process data. This may be another difference between us. Please let me know if the problem is still there after you check the header or reprocessed in ENVI 5.5 standard. Thanks, Feng
-
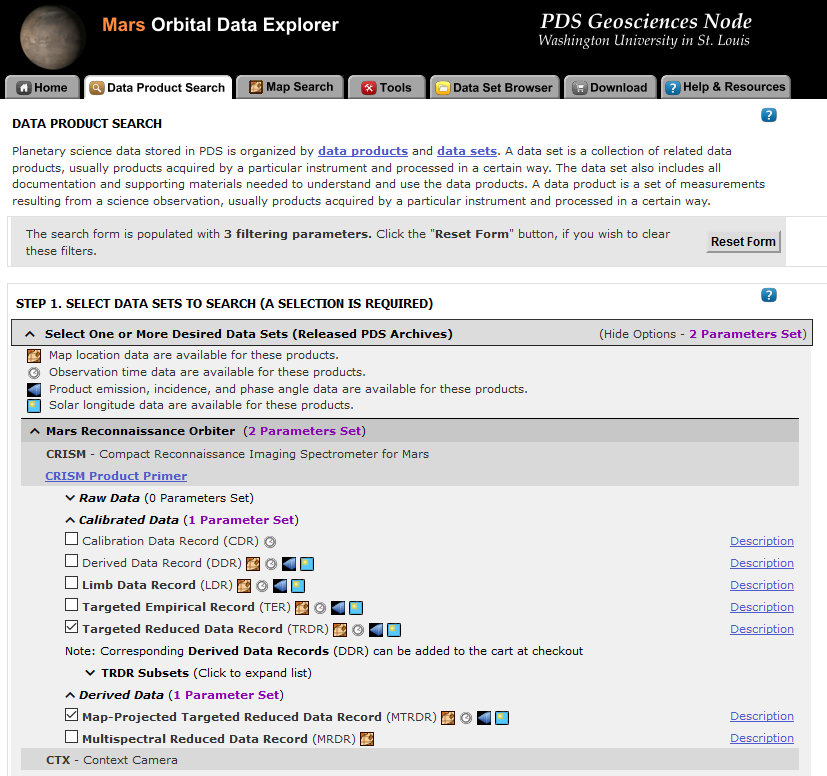
Right processing workflow for TRDRs and others
Feng replied to Wladimir Acevedo's topic in For data users
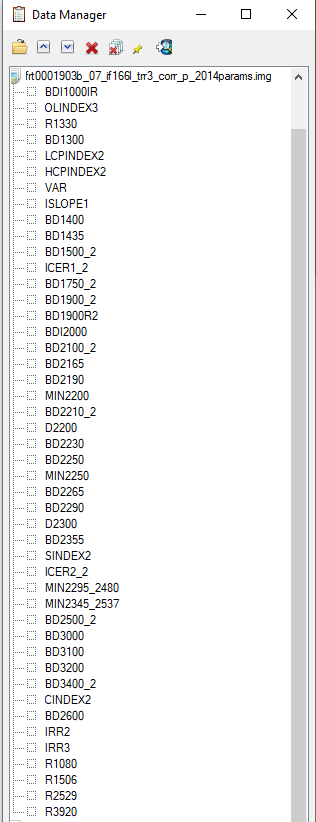
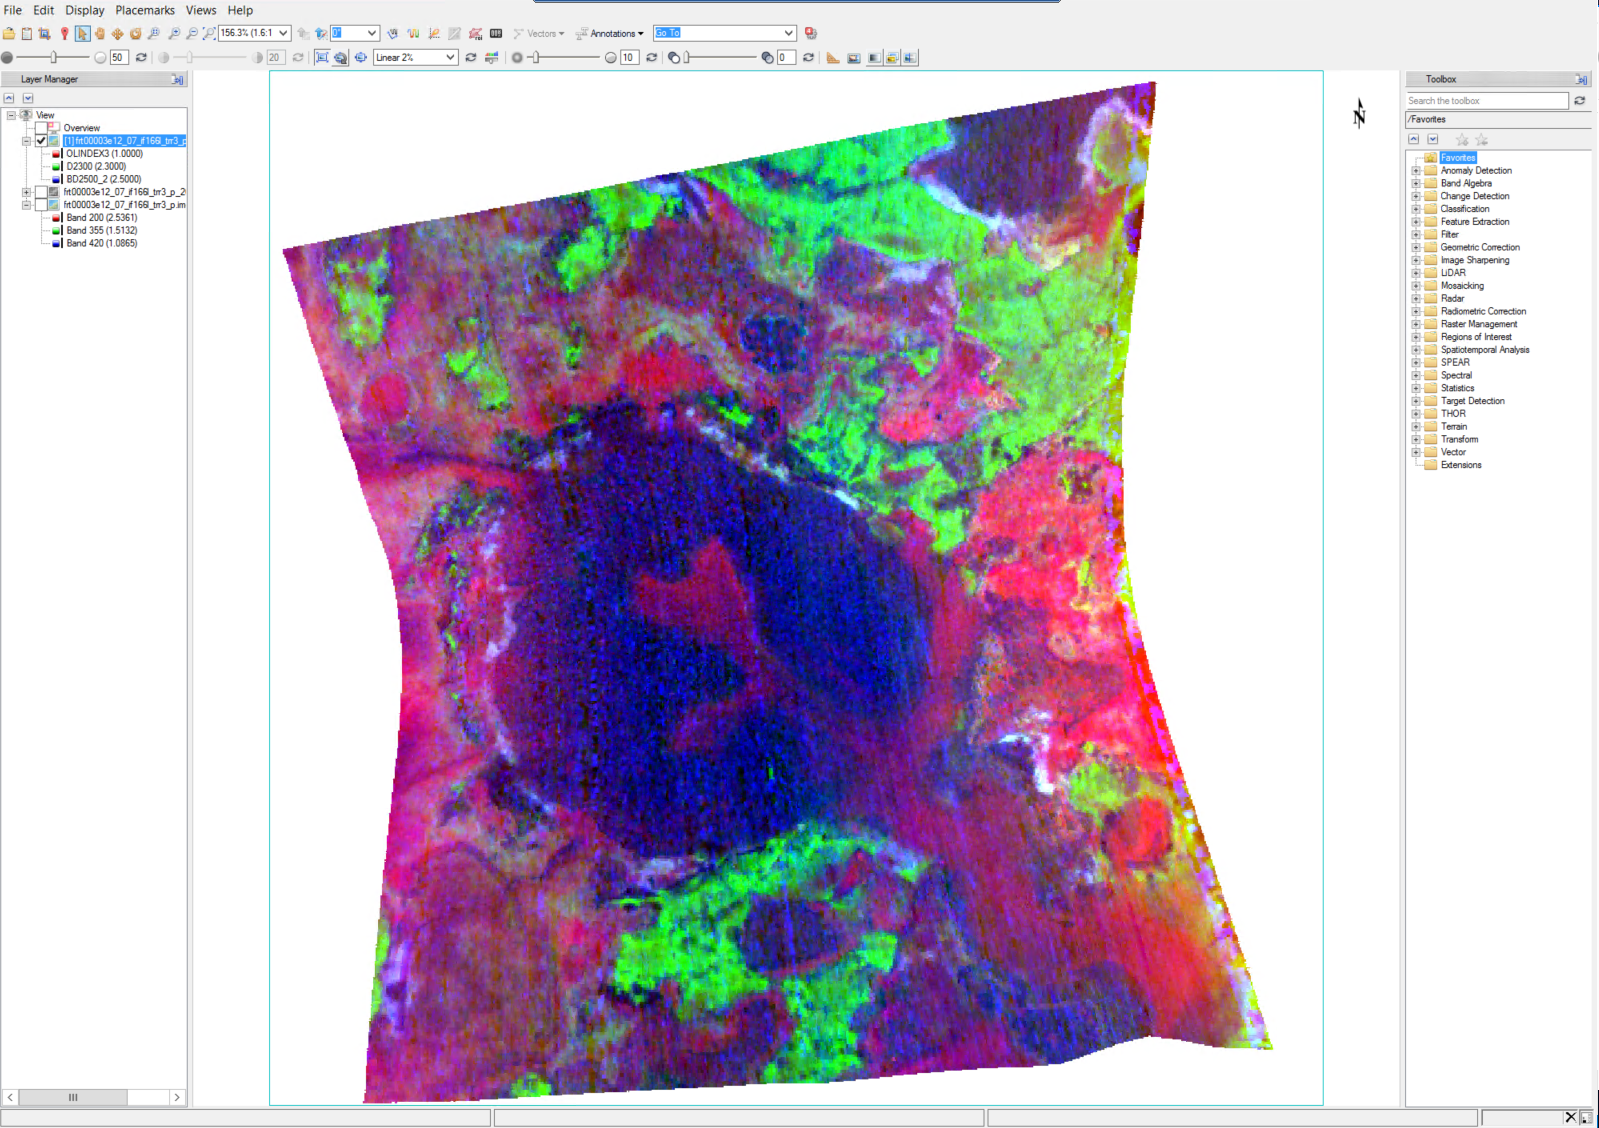
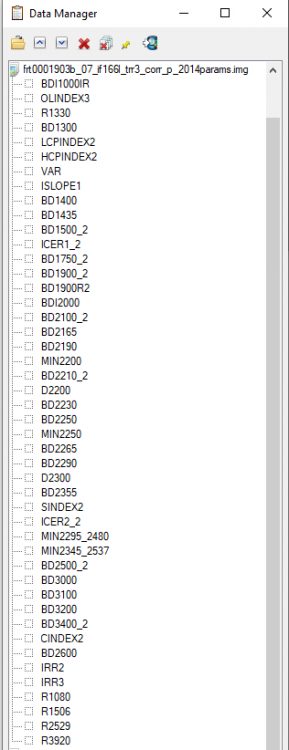
Hi Wladimir, This is Feng, I will try to answer your questions: Should I obtain the summary parameters and then apply the map projection or it is the opposite? Basically they are identical. For my opinion, I will do map projection then summary parameters since it reserves the summary parameters band name. It is necessary the "ratioing" for the spectra and use the "Flatten summary parameters" option?. I've seen a post where its says that is enough the "Continuum Removed" option Sorry I don't understand this question. I will take the team scientist about this. - How can i obtain a better resolution for the summary parameters image?. I've seen very good resolution images from papers that doesn't look like what I have obtaining (img_1) The summary parameters doesn't change the resolution. For this product, it is 18m/pixel. Here is all CRISM EDR resolution: https://ode.rsl.wustl.edu/venus/pagehelp/quickstartguide/index.html?crism_edr.htm For some Along-track oversampled (ATO) Spatial pixels unbinned for target – 18 m/pixel cross-track, up to ~3 m/pixel downtrack, requires special processing for increased resolution; half swath length as above. For img-1, if you only select one band (BDI1000IR), you can see When I create the summary parameters image the spectra doesn't look like the TRDR pure image because the data values change. Does that mean that I have to use the spectra from the TRDR and the summary parameters image is just like a "color guide" fot the mineral phases? (img_2) Yes. For your attached Img-2, the index is not the wavelength but the summary parameters band: Finally, how can I use the summary parameters properly and elaborate mineralogical maps from they? For the summary parameters, you can read the following paper: Revised CRISM spectral parameters and summary products based on the currently detected mineral diversity on Mars https://agupubs.onlinelibrary.wiley.com/doi/10.1002/2014JE004627 Hope this helps. Thanks, Feng
-
Spectral profiles for different phases and custom products
Feng replied to Wladimir Acevedo's topic in For data users
Hi Wladimir, Would you please provide the scenes you worked on so that we can better go through from there? Thanks, Feng -
Basics for CRISM processing with ENVi 5.3
Feng replied to Wladimir Acevedo's topic in For data users
hi Wladimir, I think the only difference between yours and mine is the data ignore value. Since you cannot change -1 to 65535. How about you directly open the .hdr file in NotePad and change -1 to 65535 then save the file? You need close the .img in ENVI otherwise, you are unable to save the .hdr file. Thanks, Feng -
Basics for CRISM processing with ENVi 5.3
Feng replied to Wladimir Acevedo's topic in For data users
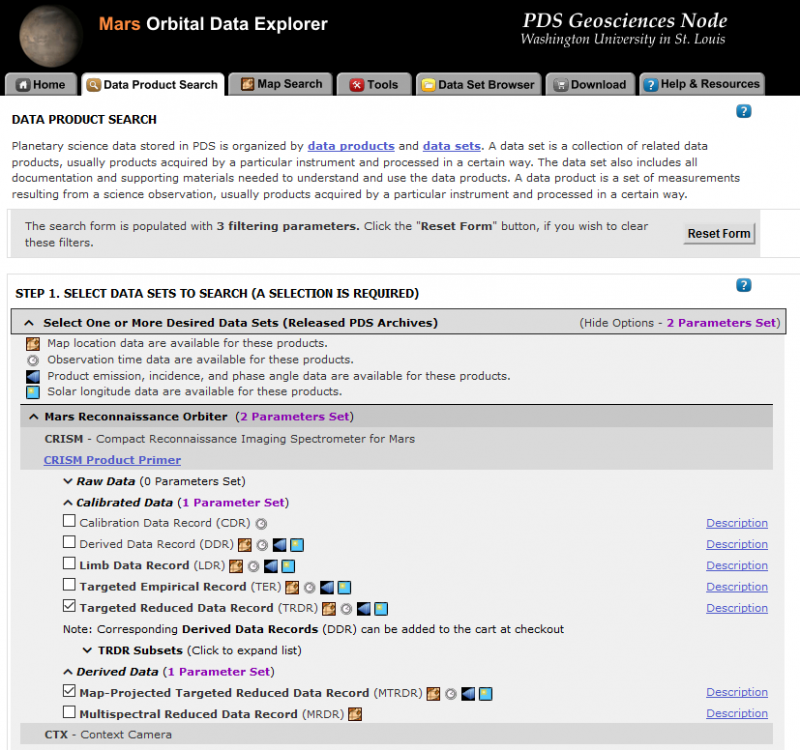
Hi Wladimir, I processed the same data as you did and there is no problem at all (the black img_1 and img_2). Would you please redo it? For your additional question, the answer from the team scientist is: The user will need to look at both the product type and data type to figure out the state of the data – and there are also keywords in the label that indicate the corrections that have been applied. A quick summary – IF TRR3 – top-of-atmosphere apparent spectral reflectance (no corrections) AL TRR3 – surface spectral lambert albedo (photometric and atmospheric corrected via RT modeling) IF TER3 – top-of-atmosphere corrected I/F – CAT-like PHT and ATM corrections (and some other steps) have been applied IF MTR3 – map projected version of the corresponding TER For these correction, you can use the ATP correction function in CAT. Thanks, Feng
-
Basics for CRISM processing with ENVi 5.3
Feng replied to Wladimir Acevedo's topic in For data users
Hi Wladimir, The CAT_WAVELENGTH_FILTER in the header files is a numeric code from PDS label (in PDS3 label: "MRO WAVELENGTH_FILTER"). It is used when reading original CRISM data into CAT. When parsing PDS label, the default wavelength array to apply to the data (i.e., the standard re-sampling wavelengths for the appropriate wavelength filter used for the observation). It is most likely a book-keeping value. Thanks, Feng -
Basics for CRISM processing with ENVi 5.3
Feng replied to Wladimir Acevedo's topic in For data users
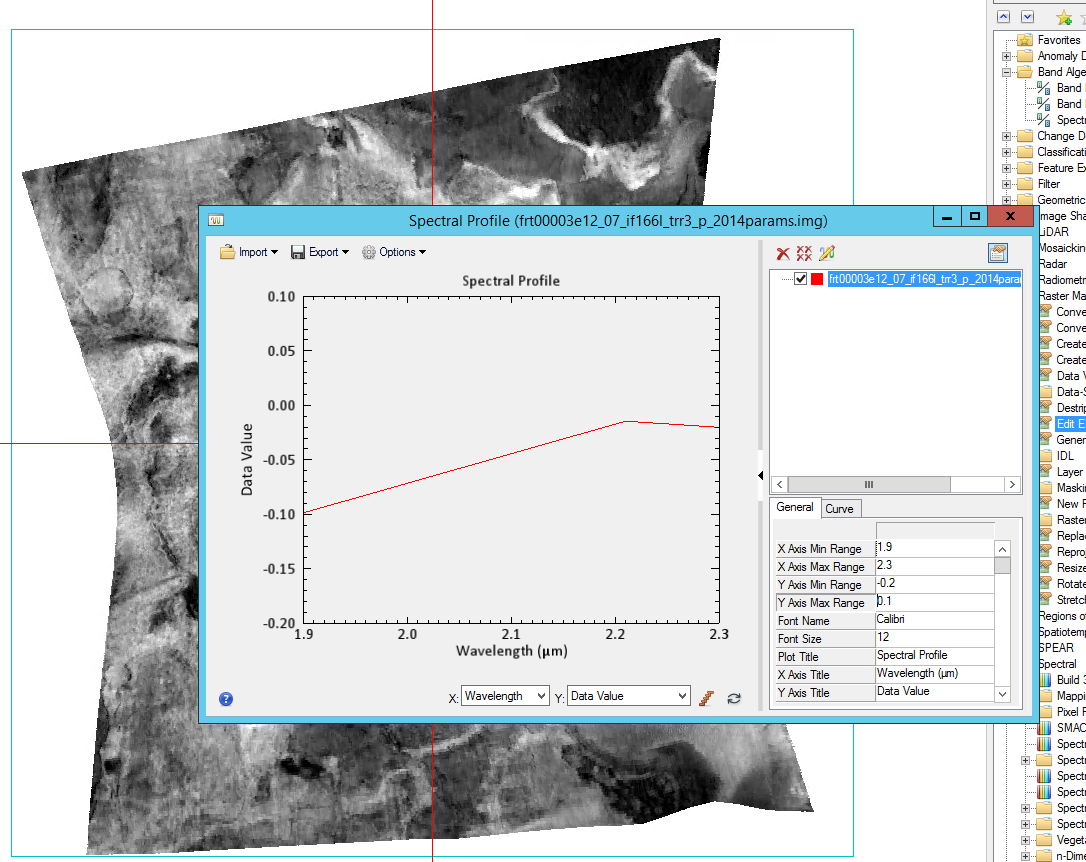
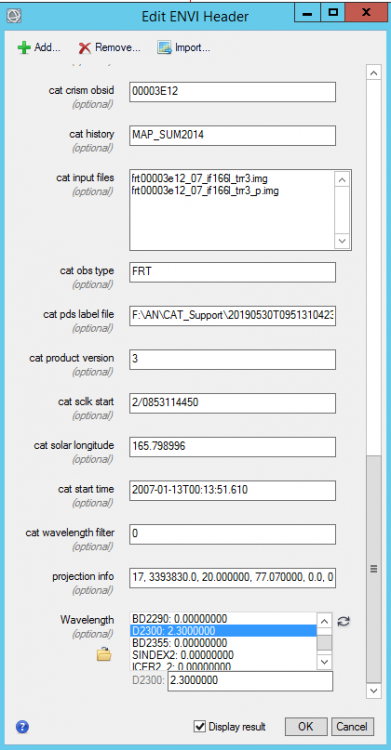
Hi Wladimir, Your adjustment of the x and y in img_2 is correct. This is also what I did to ignore the non-data or bad bands. The number 65535 is also assigned to the bad bands. That's why you see the two straight lines between 2.5 to 3.0 um. For the problem you mentioned in img_3, you can do the following step to make it work: 1, Add wavelength through Edit ENVI header 2, edit the wavelength of your selected band, for example for D2300: tyep in 2.300 then hit Enter, it will update D2300 wavelength 3, after update wavelength of your selected bands, plot the spectral profile, and change the X range: Please let me know if you have other questions. Thanks, Feng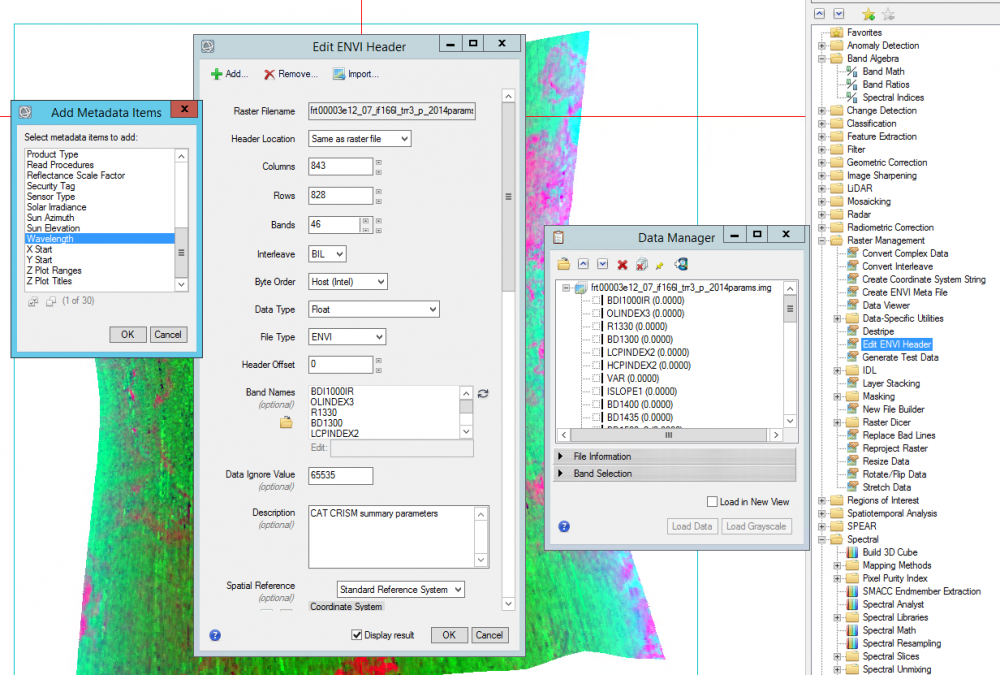

-
Basics for CRISM processing with ENVi 5.3
Feng replied to Wladimir Acevedo's topic in For data users
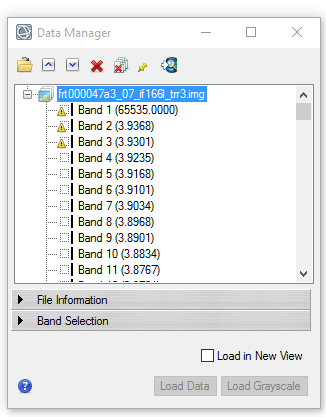
Hi Wladimir, For your first question, the trr3 is not map projected. So you will see the rectangle instead of the ones you saw on the paper. To map project the trr3, you can use the CAT map projection function. Or you can download the corresponding MTRDR (which is map projected TRDR) if it is available. I don't understand " additionally it opens inverted so i have to apply a 180° rotation. ". I think the original one is correct and you don't need rotate 180 degree. For your second question, the band 1 with value of 65535 is the non-data band. There are other bands which is bad band, these bad band data can not be used. For the bad band list you shall ignore these bands. For example, the following screenshot shows a symbol before the bad bands: Please let me know if you have any other questions. Thanks, Feng
-
CAT 7.4 is now available. User can download the latest version through: http://pds-geosciences.wustl.edu/missions/mro/crism.htm
-
Hi Harish, It is about the permission. Would you please run the IDL with "Run as Administrator" then run the previous SAVE command again? Please let me know if you still have problem. Thanks, Feng
-
Hi Chandan, It seems the customized datum is not recognized by ENVI. Would you please check if the three map projection files are in the right place? According to CAT installation document: Set up CRISM Customized Map Projection Move the CRISM customized map projection definitions files (datum.txt, geogcs.txt, spheroid.txt) from the CAT_ENVI\aux_files\crism_projection\ folder to your ENVI installed path inside the idl8x\resource\pedata\user_defined\ folder (the location of user_defined folder may vary based on your ENVI version, idl8x: idl86 for ENVI 5.3 and 5.4; idl87 for ENVI 5.5). If there files are not in the right place, please copy them to related folder and then start ENVI+IDL again. Thanks, Feng
-
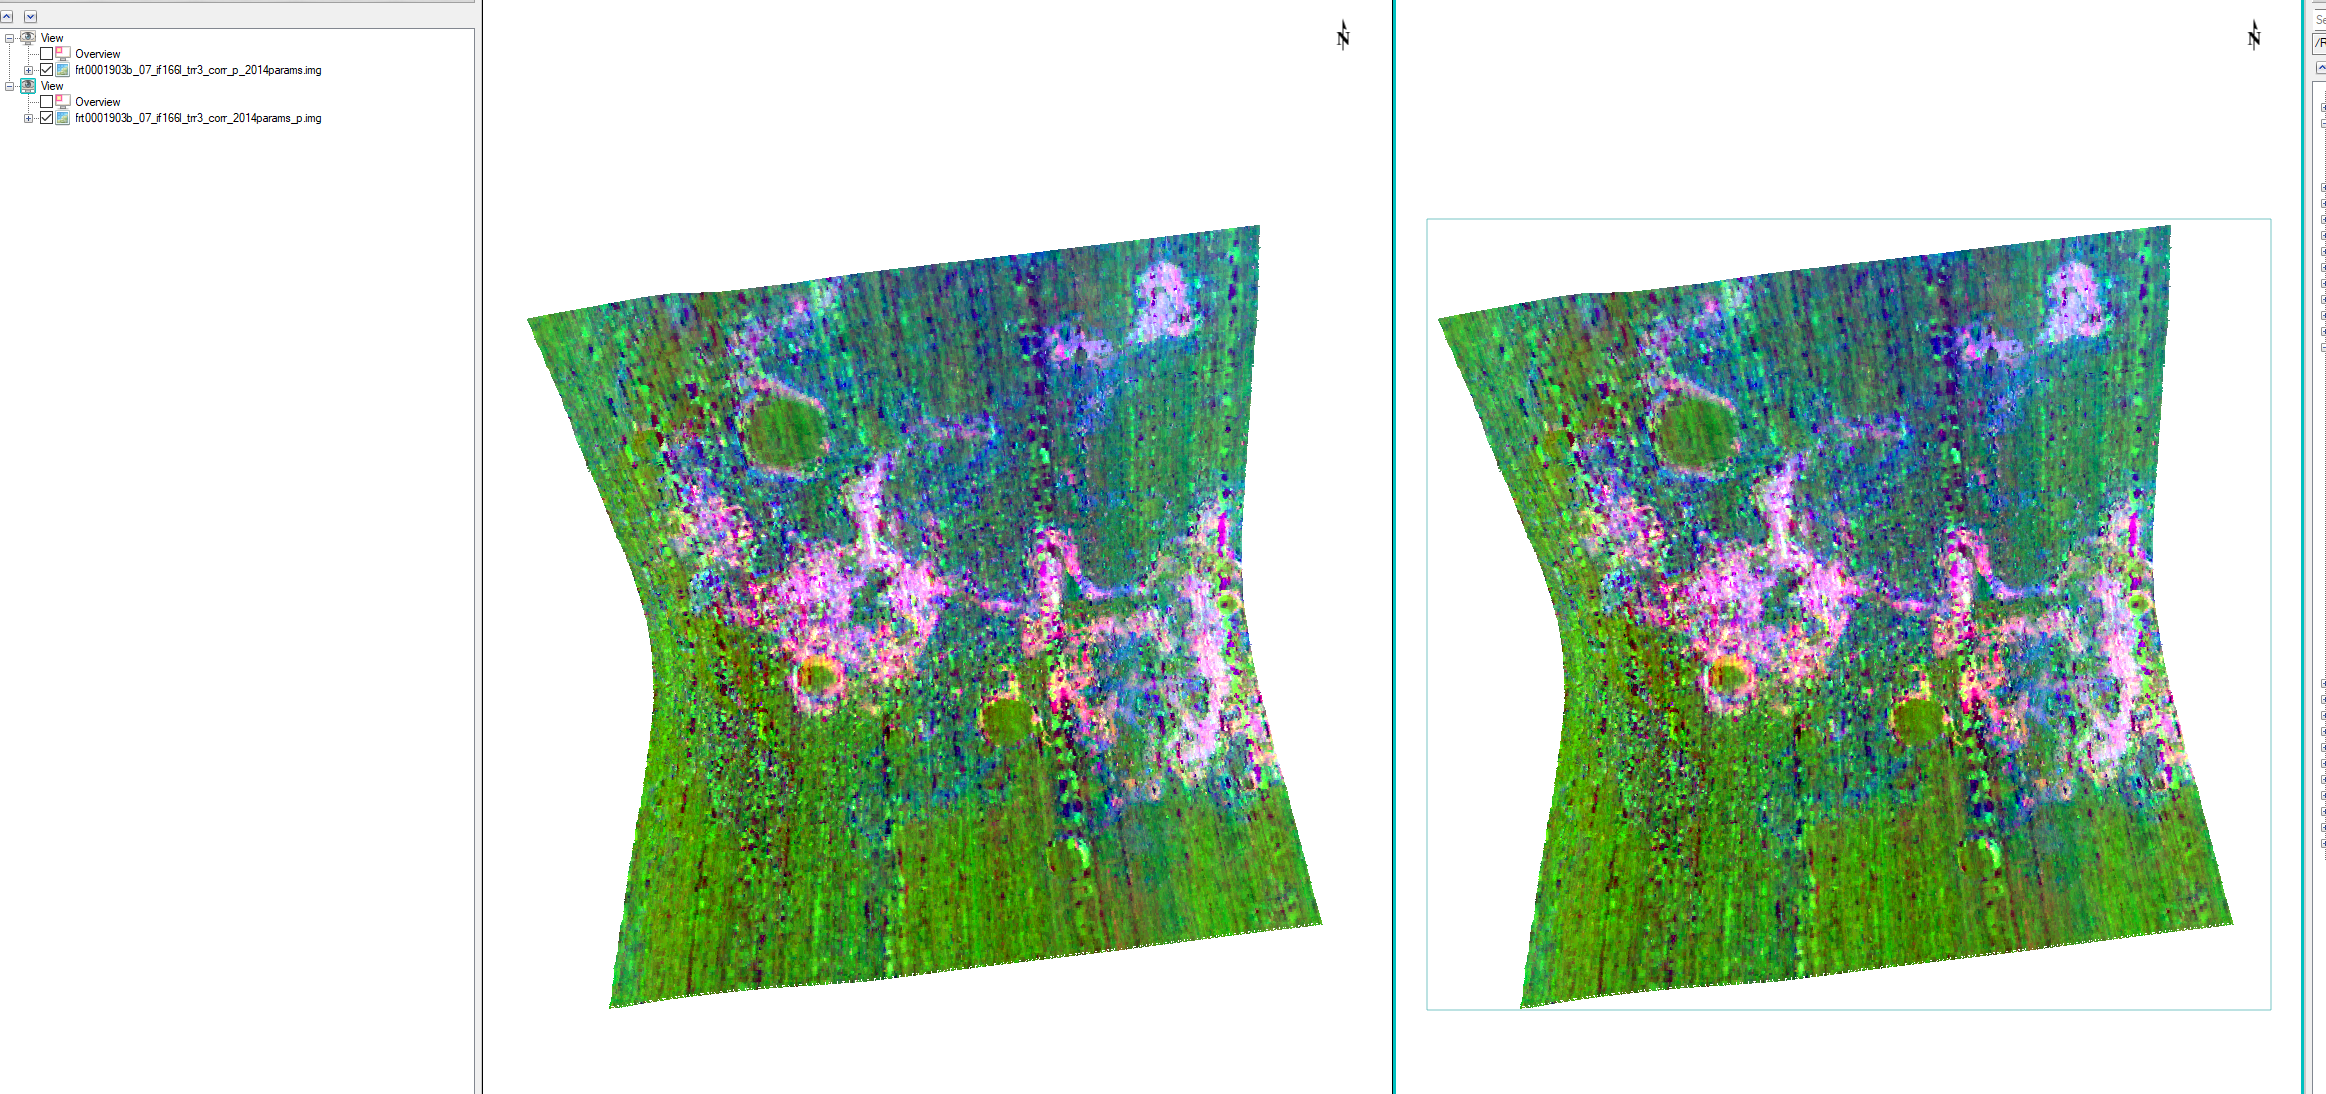
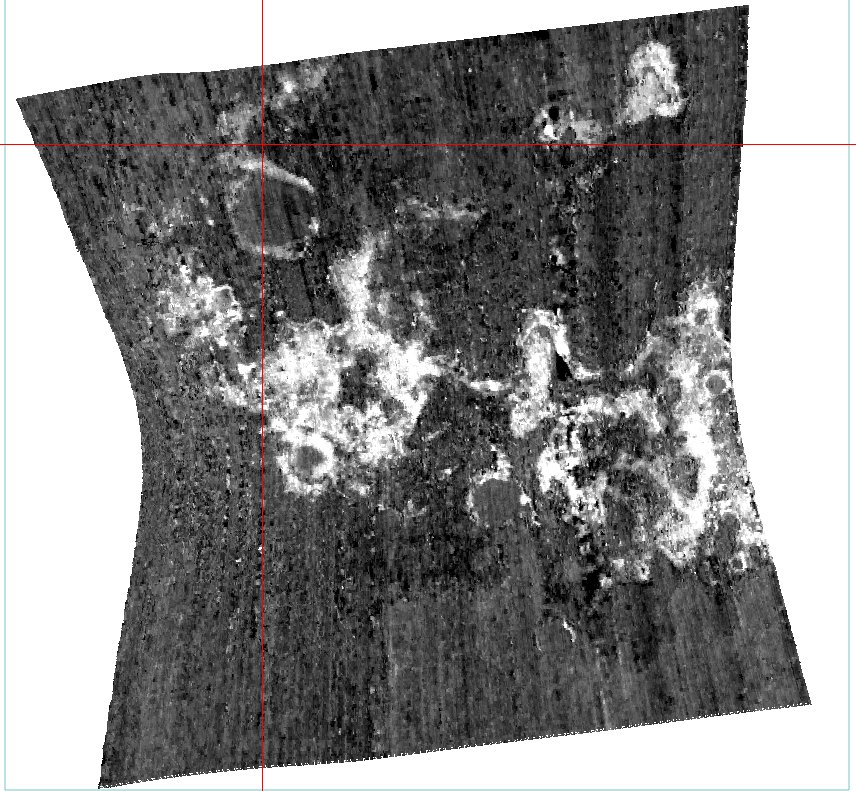
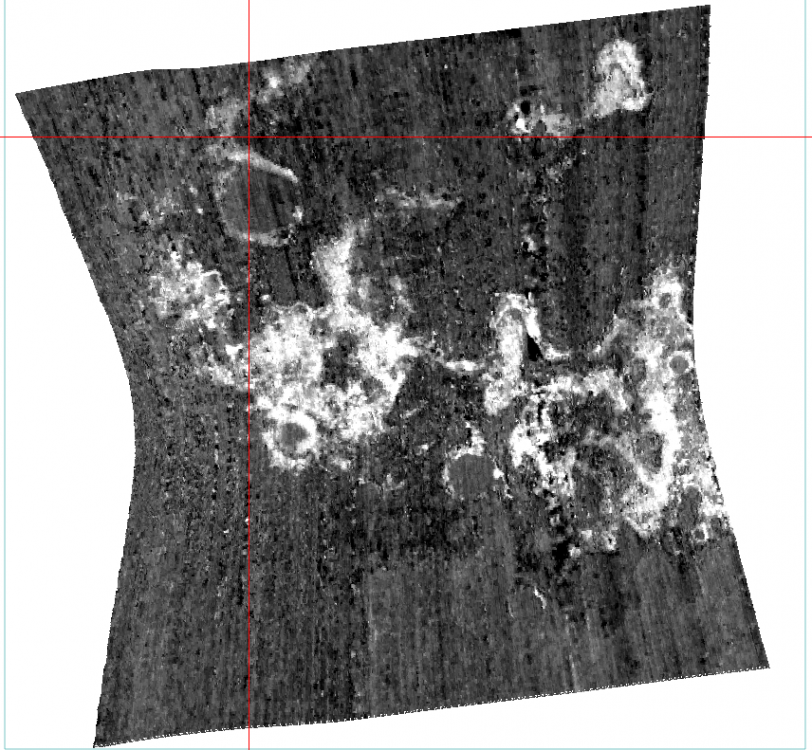
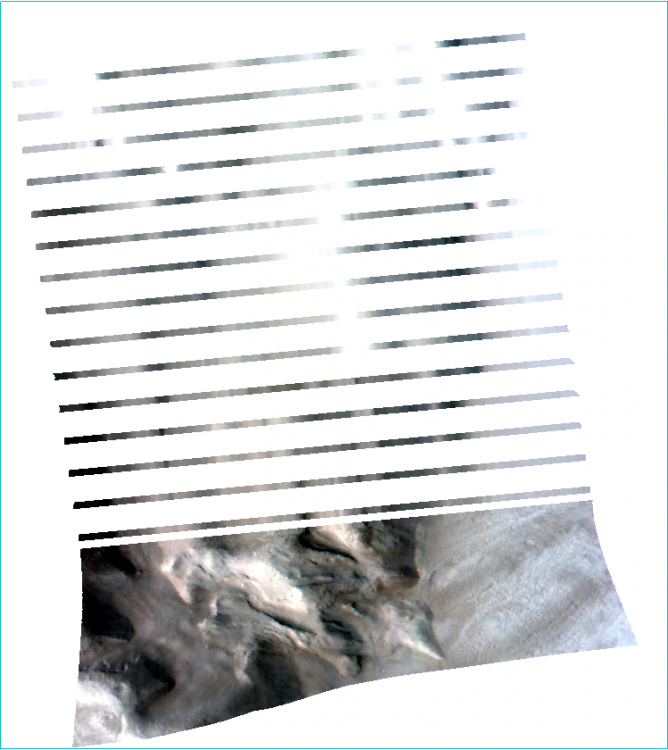
Hi Emran, There is no problem for the map context and CAT projected TRR3 image. The map context is coming from DDR which contains all lines including the key area and lines before it reaches key area. CAT map projection removes the lines before key area. If you run map projection in ENVI (on standard 5.4: Geometric Correction -> Georeference IGM), you can see all lines as following: But the lines CAT excludes is not useful and that's why CAT projection cuts these lines. Also please note: this is typical for the FRS and ATO data. Hope this answer your questions. Thanks, Feng
-
Hi Emran, This is Feng. I am going to look into this. Have two questions: are you using ENVI 5.4 standard (not classic version)? Do you copy the three map projections files inside \CAT_ENVI\aux_files\crism_projection folder to your ENVi IDL folder (like C:\Program Files\Harris\ENVI54\IDL86\resource\pedata\user_defined folder)? Thanks, Feng
-
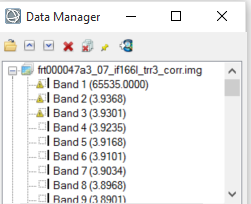
Hi Emran, The image cube product after ATP correction (...._trr3_CAT_corr.img) has all original bands (438 which include 8 bad bands, you can see it through Data Manager in ENVI 5.4 ) When you project the image cube, these bad bands are removed, so there are 430 bands left. Can you do the spectral enhancement before map projection then projection the output afterwards? Thanks, Feng
-
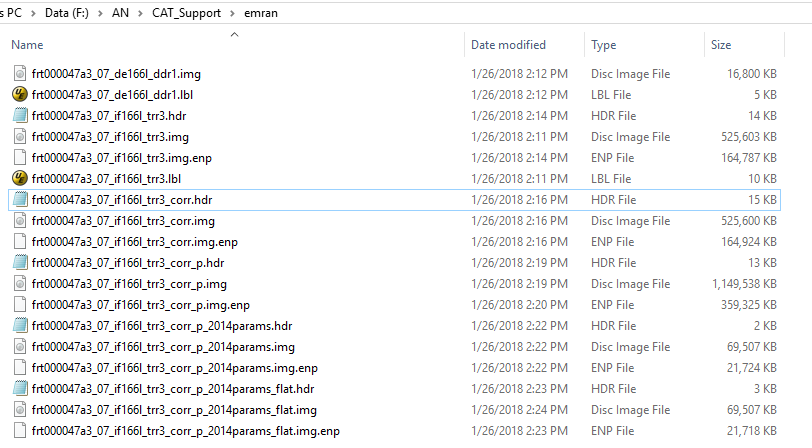
Hello Emran, Do you mean which file I used in the instruction? I use frt000047a3_07_if166l_trr3_corr_p_2014params_flat.img Thanks, Feng
-
Hi Emran, Would you please check attached file which describes the processing steps? Please let me know if you have any questions regarding to these steps. Thanks, Feng Steps.pdf
-
Hi Emran, I did replicate the error in classical ENVI. I will fix this problem. Meanwhile would you please use the recent ENVI CAT? Thanks, Feng
-
Hi Emran, You may apply Custom Stretch to stretch this image. Thanks, Feng
-
Hi Emran, I want to double check with you that the error happened on ENVI classic version not the recent ENVI version? Like your previous post shows a processed flatten image in recent ENVI version. I will run the processing on the classic ENVi to see if the error shows up. Thanks, Feng
-
Hi Emran, I never see this error before. So I try to see if I can replicate this error on my end with the data you are working on. It went smoothly without any error. See screenshot below. What is your ENVI version? Thanks, Feng
-
Hi Emran, Would you please attached the hdr file of the data that you process the flattening summer here? Thanks, Feng