

PRIYANKA
-
Posts
11 -
Joined
-
Last visited
Content Type
Profiles
Forums
Downloads
Blogs
Posts posted by PRIYANKA
-
-
Thankyou for this information sir.
So in this case which data product we should use to understand the current scenario of martian surface?
-
Hello sir,
I am Priyanka Kumari currently working on mineral mapping using CRISM Data. I want to know why MROCR_40001 (MTRDR DATA) Is not available after 2012?
I need recent mtrdr data for my current research.
can you please help to get MTRDR data from 2015 to 2021?
-
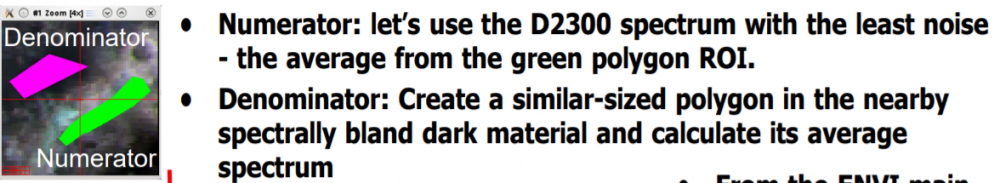
as it is mentioned here that choosing denominator will be similar size spectrally neural dark area nearby numerator. what is the reason of choosing area nearby numerator ? why we are not taking any dark material throughout the images? and how we are getting stretch limit for each of summary parameter?
-
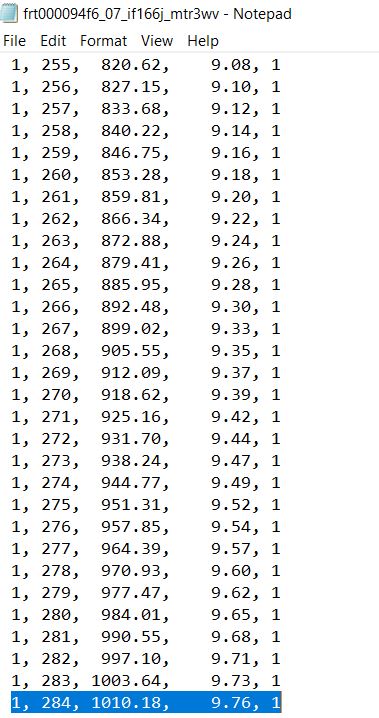
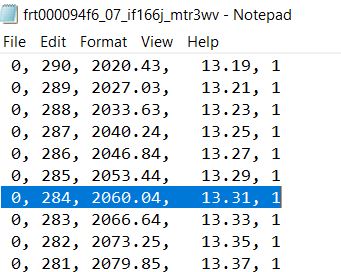
Hello sir, I am Priyanka Kumari PhD scholar working on CRISM data set using machine learning. The MTRDR data wavelength tab file (frt000094f6_07_wv166j_mtr3) contain wavelength for two detector ,but some band are repetitive (for example band no. 284 in VNIR detector has wavelength 1010.18nm but same band no. 284 for IR detector has 2060.04).
(1)So, for band no. 284 which wavelength to consider?
(2)how the image are combining that same band number has different wavelength?
wavelength to consider?
-
THANKU SIR
-
I am Priyanka Kumari Ph.D. Scholar , working on CRISM DATA . I am using CAT TOOL for preprocessing of CRISM data, but I want to use DISORT model for preprocessing. How can i get DISORT model software?
-
On 11/24/2020 at 3:16 PM, Ausiàs R said:
Hi,
Take a look to these pdfs (more precisely to the last one):
https://pds-geosciences.wustl.edu/workshops/CRISM_Workshop_Mar09.htm
Ausiàs.
thanks a lot
-
Hello sir,
I am Priyanka Kumari PhD scholar working on CRISM data set using machine learning. I wanted CRISM labelled data set to train the neural network model, how can I get labelled CRISM data set?
-
On 3/3/2020 at 9:07 PM, Ray Arvidson said:
Hi There:
I am the manager of the PDS Geosciences Node and also a CRISM Science Team Member. The I/F data you are using come from the spectral radiance for each band and pixel location divided by the solar spectral irradiance divided by pi. The is a ratio of spectral radiances and the pi converts solar spectral irradiance to spectral radiance. The solar value used is specific for the heliocentric distance when the scene was acquired, i.e., Mars distance relative to he sun. Your I/F spectra, put through the volcano scan correction using CAT, look good. Here is what you are missing. The next step typically is to then divide the volcano scan corrected I/F spectra by a spectrum from the same corrected data for an area that looks like it is spectrally neutral. This removes any instrument artifacts and tends to de-emphasize the ubiquitous basaltic sands and regolith and thus emphasizes what might be unique in terms of mineral signatures for the area of interest. It kind is like in the lab when you use reflectance spectrometers you ratio your data relative to some standard surface. Remember there are no pure outcrops of given minerals on Mars, rather wind mixes things a lot. I hope this note helps. Please ask more questions if needed.
Ray Arvidson
hello sir,
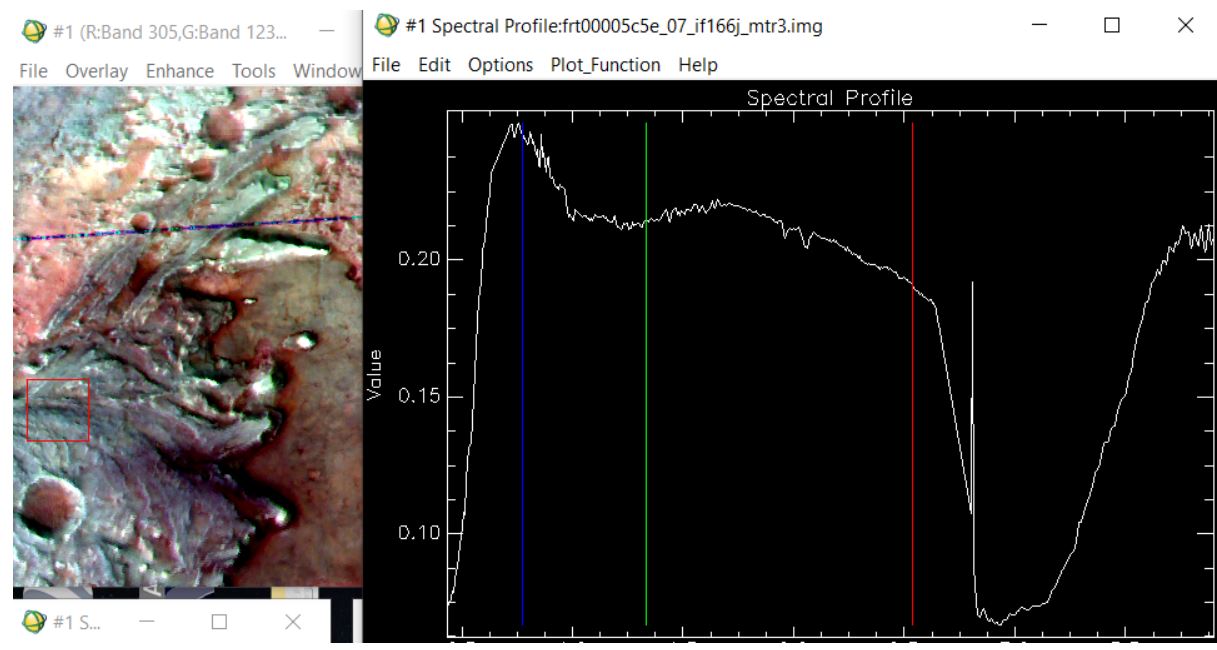
here you have mentioned sir to divide the volcano scan corrected I/F spectra by a spectrum from the same corrected data for an area that looks like it is spectrally neutral area.? what is process of choosing spectrally neutral area in a corrected i/f image
-
hello sir,
i am PhD scholar currently working on classification of CRISM data .
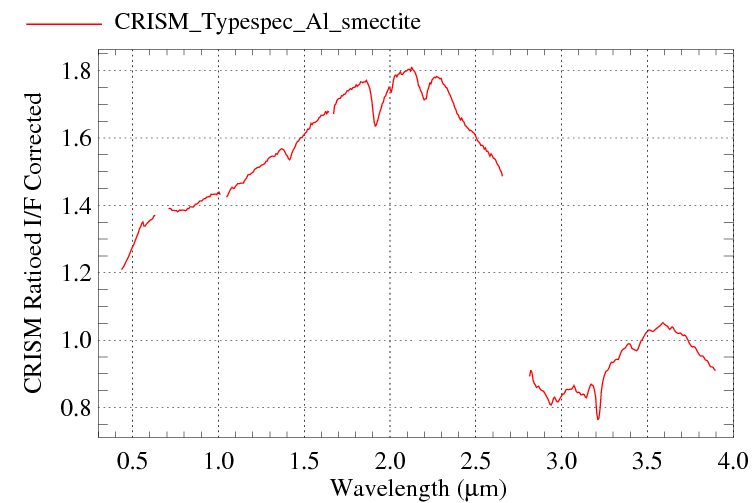
I have some doubt regarding mica type spectral library ,firstly what is the process of getting numerator I/F AND denominator I/F?
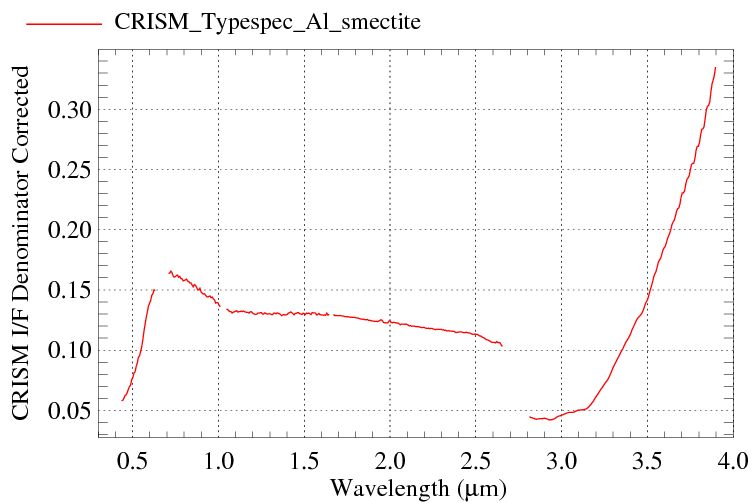
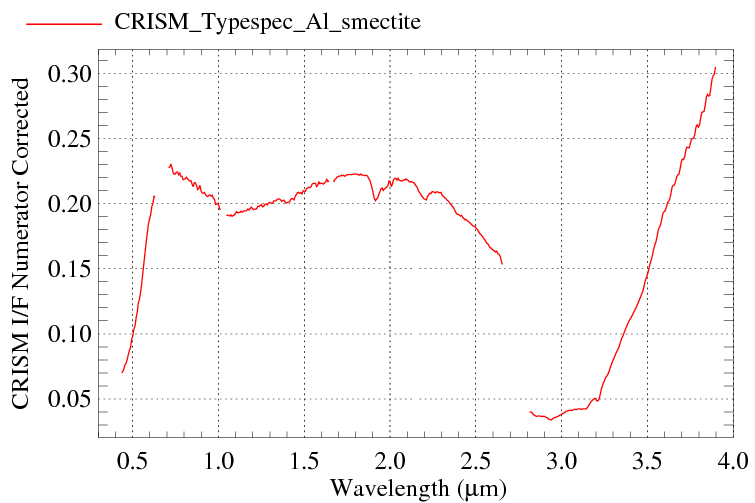
secondly ,ratioed i/f corrected spectral profile graph range is different from the spectral profile of my matching image(i am using mtr3 dataset)?


MTRDR DATA
in For data users
Posted
thankyou for the information sir
yes sir I am using the CAT tool using ENVI software.
TRR3 data set has FRT(Full Resolution Target) file till 2012 but after that hsv. file (Multispectral data) is present till 2020.
So, why hyperspectral data is not available after 2012?