

Shyam Mohan
-
Posts
10 -
Joined
-
Last visited
Shyam Mohan's Achievements
")
Newbie (1/14)
-
The LOLA data derived products, Digital Elevation Model Coregistered with SELENE Data(SLDEM) and Gridded Data Record Shape Map(GDRDEM) in the south polar region 85S to 90S shows data with only 30m/px resolution. However the South pole atlas, https://www.lpi.usra.edu/lunar/lunar-south-pole-atlas/ discusses data with 5m/px resolution. How and from where can I download the 5m/px resolution DEM of the Lunar South pole region?
-
Missing tif files in some LROC CDRNAC products
Shyam Mohan replied to Shyam Mohan's topic in For data users
Thank you Susie for the reply. I am using the data for scientific purpose and hence I prefer to use 'img' instead of 'tif' files which are compressed. Ironically, I read (https://en.wikipedia.org/wiki/TIFF) that 'tif' file format use lossless storage and thus there is no compression. I could locate the 'tif' file corresponding to the product id M1185002263RC in the link that you shared. Initially, I was searching for it in the below link and I could not find it,http://ode.rsl.wustl.edu/moon/productPageAtlas.aspx?product_id=M1185002263RC&product_idGeo=20666502 I am not sure if the below question should be intended in this forum, however I am posting it, How can I read a '.img' file in MATLAB? What is the toolbox or function to read and visualize an 'img' file ? Thank You, Shyam. -
Hello all, Most of the LROC CDRNAC products has both '.img' and '.tif' files. I am assuming that both the files contain images of the same region but the '.img' files have meta data. I have observed that '.img' are typically 300MB and '.tif' files are 30MB in size. I have the following two questions, 1. Why is the '.img' file typically 10 times larger than the '.tif' files ? Is the meta data some huge in size? 2. Some products, for example M1185002263RC does not have a 'tif' file. Is it not available for some products? I am actually creating a mosaic area of 10x10 Km using LROC images of 1.5m/pixel resolution (approx) by stitching them together. I am using MATLAB for this purpose and it can only read '.tif' files. Any help or suggestion would help me in moving forward. Thank You, Shyam.
-
Hello Jennifer, Thank you for your time and clear explanation. I could confirm the scaled pixel width(p_width) from the spacecraft altitude(h) and camera parameters. p_width=2*h*tand(FOV/2)/x =2*tand(2.8502/2)*144.07*10^3/5064 =1.42 where FOV is the camera field of view and x is the total line samples. The scaled pixel width of the images, M1099037220LC and M1108467737LC are 1.44 and 1.42 meters/pixel respectively. The are close to each other since their altitudes are very close (144 and 141 Km). I have two follow up questions, 1. The scaled pixel height of M1099037220LC(0.75) is lower when compared to that of M1108467737LC(1.42). Is it because the spacecraft was at lower velocity in case of M1099037220LC that the downscan resolution or the scaled pixel height was lower? I am asking this out of curiosity. 2. Now that an image can have different scaled pixel width and height. What do you mean by Map Resolution? The definition in the label file says "The calculated pixel resolution at the center of a NAC or WAC observation." How is Map resolution and scaled pixel width or height related ? Is there any document that explains these parameters in detail. 3. As per the definition of slew angle in the label file, it is the Angle of LRO off nadir when observation acquired. Is it not same as emission angle? How is slew angle related to emission angle ? I am referring to the label file in the below link, http://lroc.sese.asu.edu/data/LRO-L-LROC-3-CDR-V1.0/LROLRC_1012/INDEX/INDEX.LBL. Please let me know if you need any clarity on the questions that I am asking. Thank You, Shyam.
-
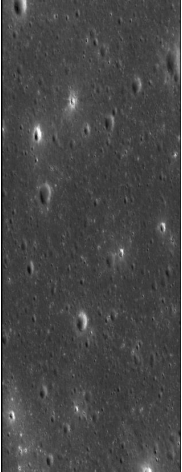
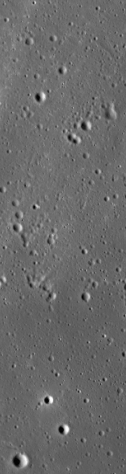
Hello all, As per the definition of Emission angle given in http://ode.rsl.wustl.edu/moon/pagehelp/quickstartguide/index.html?seach_page.htm#filterbyanglerange, higher values of emission_angle indicate more oblique viewing. Consider the two LROC products M1099037220LC and M1108467737LC with a very close emission angles of 1.78 deg and 1.76 deg respectively. However M1099037220LC appears to be very oblique with elliptical shaped craters and M1108467737LC appears to be nadir looking with almost circular craters. Can you please explain why is it so ? The screenshot of the LROC images are attached for you reference. Thank You, Shyam.
-
Dear all, Do you need any clarification on the above question to be clear? Thank You, Shyam.
-
Hello All, Consider the LROC Product ID M181345381RC.The details of the latitude and longitude are as follows, Maximum Latitude 30.2 Minimum Latitude 27.72 Westernmost Longitude 333.81 Easternmost Longitude 334.13 The above values have a precision of only two decimal points which means a maximum of 0.005 deg error is possible. If we assume that that the angular resolution of moon is 30Km/deg(approx) then there can be a map tie error of 30000*0.005=150 meters in position. Is there any other source of information with higher precision? If not, can we assume that 150m is the maximum map tie error expected from LROC products? Thank You, Shyam.
-
Thank you all. Your support is valuable.
-
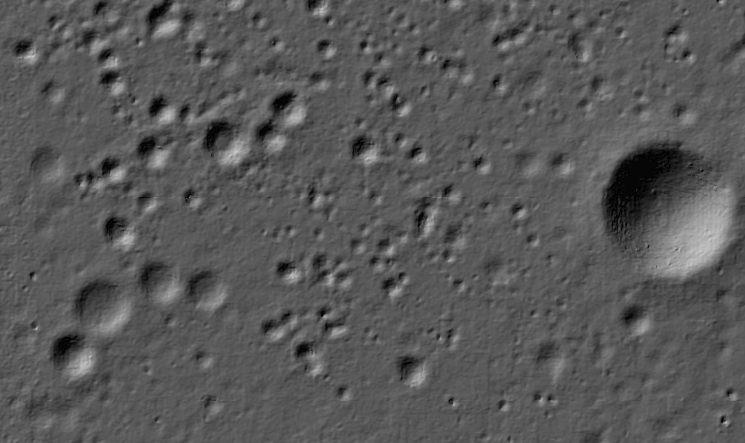
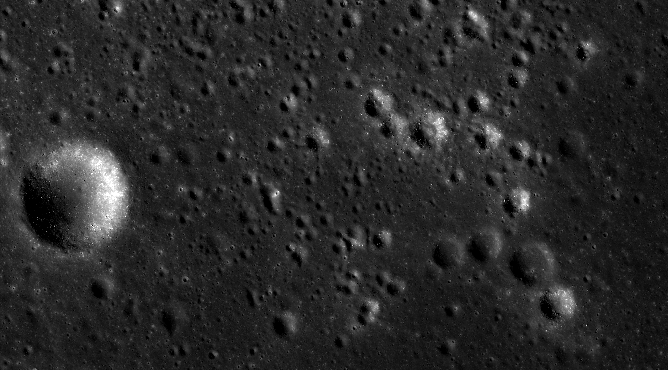
Thank you for a quick response. I understand that the left and right of an image is not always the west and east of real direction and it depends on the depends on the flight direction of the satellite. I expect one image to be a180deg rotation of the other if the flight direction changes. For example if the flight direction is such that the camera moves from south to north then I might get a vertically long image with the up direction being the north, down direction being the south, right direction being east and left direction being west. If the flight direction changes and the camera moves from north to south then the up direction of the vertically long image is south, down direction is north, right direction is west and left direction is east. Essentially if one image is flipped both left and right and up and down then I should get the other image. However this was not observed in the images that I am referring to (cropped images are attached). If you compare the LROC quickmap with the product M1106080949LC then the up and down directions remain same without any flip. You will notice that there is a flip in the left and right directions only. This is strange unless the camera itself stores the image in a flipped manner along one direction only. Could you please help me in understanding this problem?
-
Consider an image downloaded from the Lunar Orbital Data Explorer (http://ode.rsl.wustl.edu/moon/indexProductSearch.aspx). If you filter the LROC-CDRNAC product by the below location then you will get the image with the product ID M1106080949LC. Minimum Lattitude : 29 and Max Lattitude : 30. Minimum Longitude : 334 and Max Longitude : 335. However if you compare the above image with the LROC image in the below link then you will realize that the images do not match and there is a flip along the vertical line. http://quickmap.lroc.asu.edu/?layers=NrBsFYBoAYchGSJQBYF3gXSaUdZY4Ds%2BC2YAHKYWAJzXlGzNlJGIs0BMttVn5HrwaZBoLtSTAuoDhnIBmaF37ykKpSPLx4UAuhA60ApDpJyaS6HIKCK7Bqc0ng8BTdauFCx17wu3EgCFehcNCTD7CLVXFBZbdQpQUPlRJAUuaP0QDI8sNOAlENJoADooHOg4rXToBWN8cqkivVTFOp9OZuUU5nL250bwAY8y4dqMkv6ChXFJHNkprnHC0E6hxVQpldnWvuGZutV97tntgaCNmaIG7MKidb7ddq5bmFLn2uWpz8Llf0avyUXEuTwOiiIALuCiIe08MOO8KIvXhFHiqLyigoWVRj1Rb3y5Di6MQOWELmBeMsyhxhPSoFBBlWUPhoER3HsJM2KMsTF8MMx6SItNERNe82AKC4eLKCjFcNlYpZZVooqQKHAVKkGpF6vACum7XgPO60BZ1Kq-OgdSt1t84C4XMSa18KggrqSBLsuA9bJqwHAugwTMDXqQgcZNED7PIgZ5sa4o1KRATOLKKedkfayltcMJmCAA&extent=-28.872073427042995%2C26.705657147802196%2C-21.410826670490174%2C30.65888125804206&proj=16 I am assuming that the above link is giving the right image and the image from the Lunar Orbital Data Explorer is flipped. I would to like to know if this is true and if yes then why is there a flip in the image product from Lunar Orbital Data Explorer. Thank You, Shyam.