

Feng
-
Posts
53 -
Joined
-
Last visited
Content Type
Profiles
Forums
Downloads
Blogs
Posts posted by Feng
-
-
Hi Cat,
I think the same result is because your ROI is only on one image. If you want to see the statistic on different image, you need create ROI on that image. Please let me know if this answers your question.
Thanks,
feng
-
Hi Al,
After communicating with CRISM team scientist (Dr. Frank Seelos), he suggests:
"For this kind of thing it’s probably easier to work with the sensor space TERs and then move back into the projected space at the end of the workflow. However, the MTR IN (information) product does have the pixel traceability info into the source VNIR and IR image cubes, so with some indexing it is possible to work ‘in column’ in the MTRs."
Thanks,
Feng -
Hi Cat,
S and L have different wavelengths. Different minerals absorb and reflect light at different wavelengths. By using both L and S bands, you can analyze the spectral signatures of minerals and identify its presence. To be more familiar with CRISM data and how to use them, Would you please check the following link for walk-through of using CRISM data?
Please let me know if you have other questions.
Thanks,
Feng
-
Hi Catalina,
I hope I can help you to fix the problem.
Recently we have updated the CAT map projection function due to an error happening on the new operation platform. I have several questions:
1, is your CAT package recently installed? If yes, maybe we can switch to the old package since you are using the old ENVI version. If not, did you see the error before when you use CAT?
2, If the above one doesn't fix the error, can you update ENVI to 5.6 or above?
We can set up a zoom session to troubleshoot this error if you like.
Thanks,
Feng
-
There are several users reported an error when using CAT to do the map projection. The error shows:
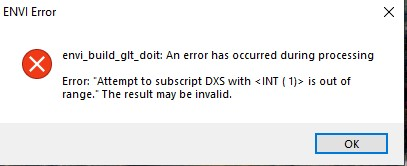
I have tested CAT in different platforms and confirm that this issue is platform-related issue. For windows 10, windows server 2019 and older versions, there is no such error. But for windows 11, windows server 2022, or other new iOS , the error shows up.
I reported this bug to ENVI support but not sure how long it will take to fix this. I will post an update once there is a solution. Please stay tune and thanks for your patient.
Update:
Attached are the fix files and instruction for this error (please rename the file extension txt back to pro. This is due to the forum limitation of upload file format ). The zipped fix files or updated CAT package will be posted in following link soon:
https://pds-geosciences.wustl.edu/missions/mro/crism.htm
Note: ENVI team does not have a fix to this bug in near term. Moreover, our fix is based on ENVI standard thus it does not apply to ENVI classic interface. Therefore, we strongly recommend user to switch ENVI standard interface.
-
I tested CAT in different platform and confirm that this issue is platform related. For windows 10, windows server 2019 and below, there is no problem at all. For windows 11 and windows server 2022, or other new OS, the error shows up. I reported this bug to ENVI support but not sure how long it will take to fix this.
-
Array scanning spectrometers are becoming an important element in remote sensing, particularly for in-situ studies. Often times the data are provided as spectral libraries and not a spectral image cubes. To support conversion of individual spectra to spectral image cubes we provide an IDL script that takes individual spectra and creates the cube. To run the script download the attached file and in ENVI/IDL (standard ENVI, not Classic) run create_library_cube.pro in IDL, then run it in the IDL prompt by typing create_library_cube, param1, param2, param3 (for example: create_library_cube, 10, 10, 0) or just create_library_cube if you don’t want to specify any input parameters. Explanations of Param1 to Param3 can be found in comments included in the IDL pro file.
IDL script:
; Created: Apr. 18, 2023
; By: Feng Zhou
; Edited: May 3, 2023
; input parameters:
; cubeCol: int, designed output cube column
; cubeRow: int, designed output cube row
; zzFlag: int, 1 or 0, if 1 then convert spectra to zig-zag matter,
; for example we are using 10X10 cube as an example
; Each image cube is 10 spectra by 10 spectra taken as a raster across the surface.
; The first row has spectra 0 thru 9, the second row has spectra 19 thru 10, and so on (the spectra are ordered in a zig-zag fashion).
; if 0, The first row has spectra 0 thru 9, the second row has spectra 10 thru 19, and so onpro create_library_cube, cubeCol, cubeRow, zzFlag
compile_opt idl2
e = ENVI(/CURRENT)
lib=envi_pickfile(title='Select the spectral library to convert')
if (lib eq '') then return
envi_open_file, lib, r_fid=fid
envi_file_query,fid, dims=dims, wl=wl, ns=ns, nl=nl
spec=envi_get_data(fid=fid, dims=dims, pos=0)
; check if there are input parameters
if(cubeCol > 0) then begin
newNs = cubeCol
endif else begin
;default column value
newNs = 10
endelse
if(cubeRow > 0) then begin
newNl = cubeRow
endif else begin
;default row value
newNl = 10
endelsedata = Fltarr(newNl,newNs,ns)
data[*,*,*] =0.0
if(zzFlag eq 1 ) then begin
for i=0,ns-1 do begin
for j=0, nl-1 do begin
reminder = j MOD newNs
newrow = (j-reminder)/newNs
oddOReven = newrow MOD 2
if(oddOReven eq 1) then begin
newcol = newNs -1 - reminder
endif else begin
newcol = reminder
endelse
data[newrow, newcol, i] = spec[i,j]
endfor
endfor
endif else begin
for i=0,ns-1 do begin
for j=0, nl-1 do begin
reminder = j MOD newNs
newrow = (j-reminder)/newNs
newcol = reminder
data[newrow, newcol, i] = spec[i,j]
endforendfor
endelse
newfile = lib.replace(".sli", "_s2c.img")p=[1,0,2]
spec_out = transpose(data, p)
raster=ENVIRaster(spec_out, URI=newfile, NBANDS = ns, NCOLUMNS = newNs, NROWS = newNl, DATA_TYPE = 4)
raster.Save
Task = ENVITask('SetRasterMetadata')
Task.INPUT_RASTER = rasterTask.NBANDS = ns
Task.NCOLUMNS = newNs
Task.NROWS = newNl
Task.DATA_TYPE = 'Float'Task.BYTE_ORDER = 'Host (Intel)'
Task.INTERLEAVE = 'bsq'
Task.WAVELENGTH_UNITS = 'Micrometers'
if( n_elements(wl) gt 1) then Task.WAVELENGTH = wl
Task.Execute
newRaster =e.OpenRaster(newfile)View1 = e.GetView()
Layer1 = View1.CreateLayer(newRaster)
end
-
Hi Emran,
After communicating with the CRISM team, we got an answer from Frank Morgan, the developer of CAT:
"One possibility is to call the IDL function directly. The ATP stuff is in routines atp_nontile.pro and atp_tile.pro. Assuming they’re working with non-tile (like FRS, FRT, HRL etc) data use atp_nontile.pro.
The header describes the inputs. It takes a big structure with all the input parameters. Set the batch keyword to avoid halts on trapped errors (that mode is more lightly tested than non-batch, but hopefully will work.)
A lot of the apparent complexity in that routine is handling different data format cases, trapping errors, reading ancillary data etc. The real work is fairly straightforward. If they want to maximize efficiency they may want to pull from crism_photom_corr for photometric correction, and scaleatm_pcm and patch_vs_artifact for atmospheric correction."Thanks,
Feng
-
Hi Rob,
Sorry for confusing you. I was thinking to build a Geographic lookup table from DDR in ENVI, then reference the TRDR to GLT to generate a TRDR_GLT image, and finally re-project it in ArcGIS. I did a quick test but unfortunately, it failed in the last step.
Maybe you can try the ISIS which is open source software to do the projection. ISIS has the pixel2Map function:
https://isis.astrogeology.usgs.gov/Application/presentation/Tabbed/pixel2map/pixel2map.html
Thanks,
Feng
-
Hi Rob,
CAT does need the IDL. Do you try using the CRISM MTRDR product?
Meanwhile are you familiar to ESRI GIS software? If you have the ArcGIS installed, you may use the map projection tool in ArcTool box to do the map projection.
Thanks,
Feng
-
Hi Sehaj,
Please try the latest version 5.6.2. It is knowing issue for ENVI 5.6 that the map projection engine used in 5.6 cannot parse some strings correctly. In 5.6.2 release, ENVI fixed this problem. We had tested CAT map projection in ENVI 5.6.2 from several PCs. The performance is about within one minute. If you dodn't have access to 5.6.2, I would suggest you to switch back to 5.5.3 version. CAT map projection in 5.5.3 is also fast.
Thanks,
Feng
-
Hi Nathan,
We emailed the question to the data producer one week ago but didn't get his response. On the other hand, we think your result and code are correct. We did get the same result as yours through different method. There is some difference between SU TER and summary parameters from IF TER. I suggest you can continue your way for the further steps.
Thanks,
Feng -
Hi Nathan,
We are contacting the creator of the SU_TER products to see if there is any additional steps involved. We will let you know once we get answers.
Thanks,
Feng
-
Hi Nathan,
I am unable to run your Matlab code. I got some errors. One error is:
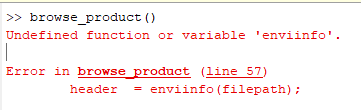
I use CAT function to compute these summary parameters from IF_TER and then compare to the SU_TER. I also got the similar results like yours. I wonder if it is caused by calculation rounding error.
Thanks,
Feng
-
Hi Nathan,
I will follow your step to see if we can have the same result. Meanwhile would you please post your result in the forum?
Thanks,
Feng Zhou
-
Hi Sehaj,
Thanks for you update. I will help you to fix these problems. To better assist you, can we go to a zoom meeting to fix these problems? You can send me (feng.zhou@wustl.edu) an email with your available time slots so that I can send you a zoom link.
BTW, would you please try the standard interface of ENVI 5.6? It has a lots of new features than classic.
Thanks,
Feng
-
Hi Sehaj,
The header error is because the customized map projection engine data for CAT is not set up correctly in your computer. You can following the instruction document (custom_pedata_instructions.docx) in CAT_ENVI\aux_files\pe_user_defined folder to set up correctly. Please let me know if you still have a problem. BTW what ENVI version are you using? I saw you use ENVI classic. Is it possible for you to upgrade ENVI to 5+ version and use the standard interface?
Thanks,
Feng
-
Hi Holger,
Thanks for bringing this to us. The AN list you mentioned is taken directly from the mission supplied document (Mars2020_Camera_SIS) and we will check with the mission team to see what changes should be made.
Best,
Feng
BTW the areo.info link in your post seems not working.
-
hi Rochdi,
My suggestion is that you merge the S (VNIR) and L(IR) cubes into one and then slice them to what you want.
The S cubes and L cubes have minor offsets. To merge them, you have to register one another. And then use attached IDL code to merge them. Following are detailed steps:
1, download the CTX covers the S/L cubes area in ODE (using Geotiff format CTX product)
for example using crism trdr (frt0001176e_07) as example:
- first search frt0001176e_07 product then show result on map, you can see frt0001176e_07 area on the map;
- select CTX layer; on map display, draw a rectangle to cover this area using "Select Products with Rectangle" tool;
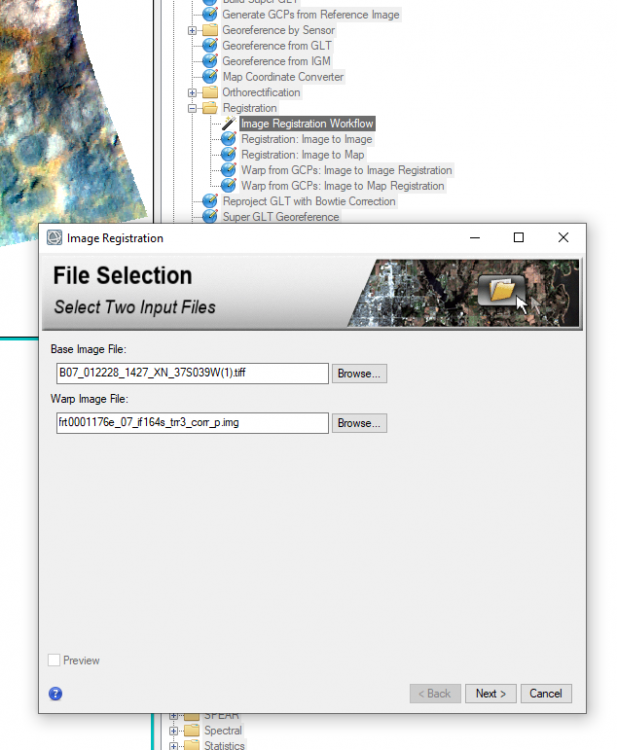
- download the CTX product in Geotiff format for exmaple (B07_012228_1427_XN_37S039W.tiff)
2, in CAT doing map projection for both S and L cubes
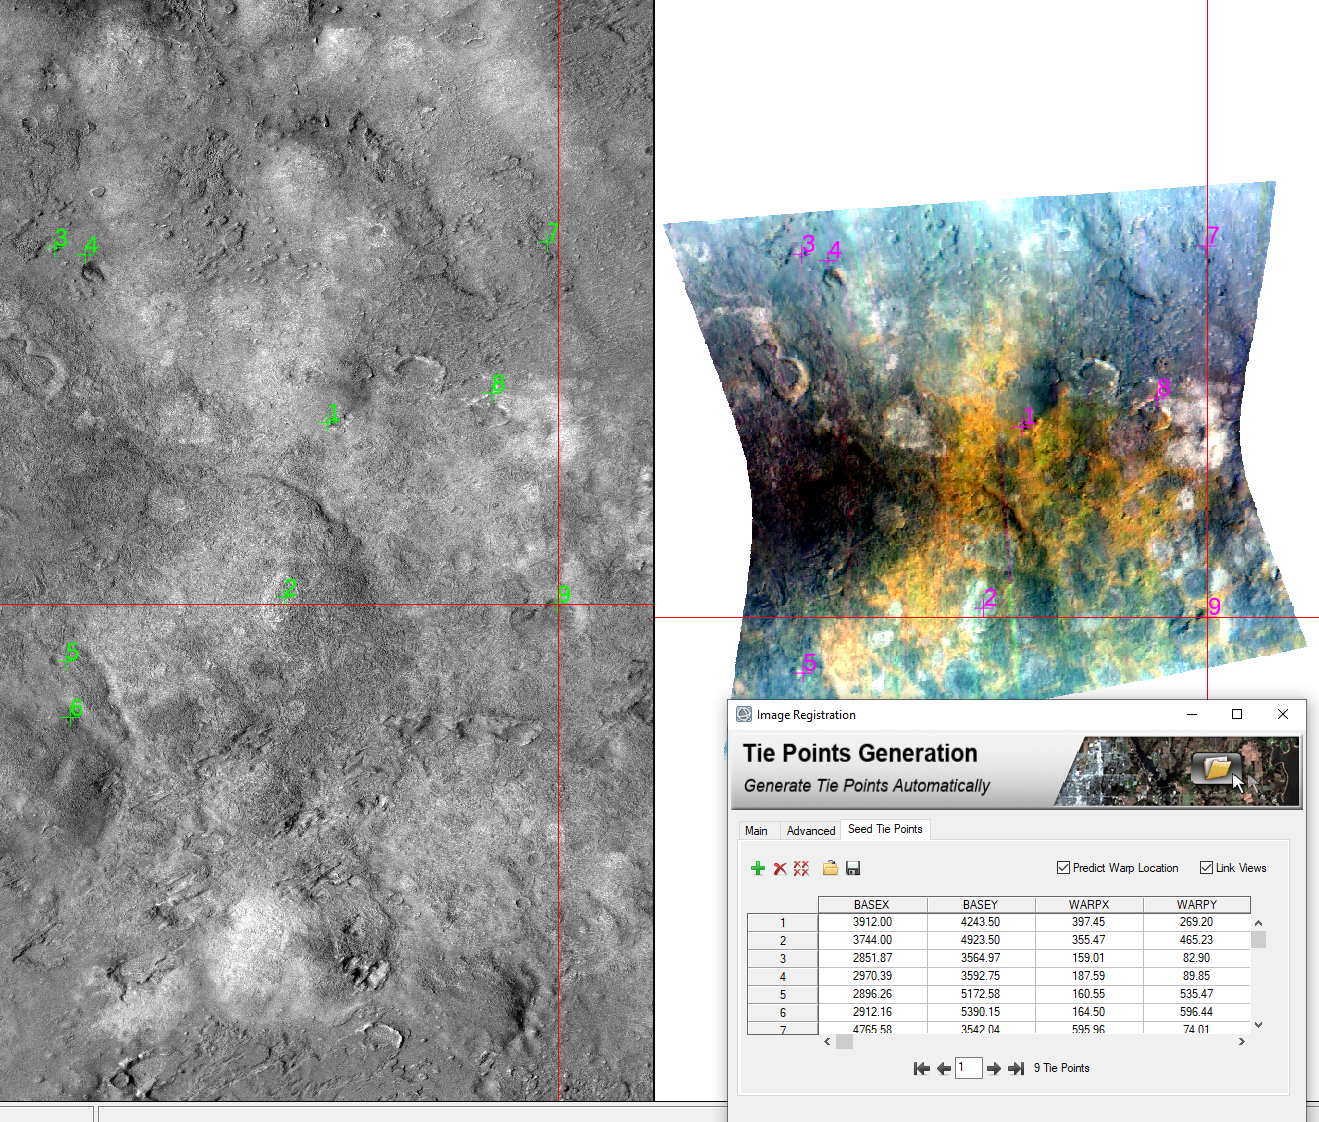
3. register map projected S and L cubes to the CTX product by using "Image Registration Workflow"
Manually select tie points (I select 9 tie points ) between CTX and TRDR:
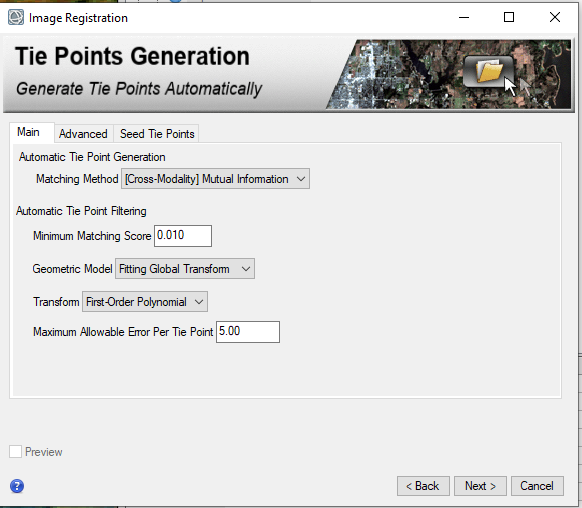

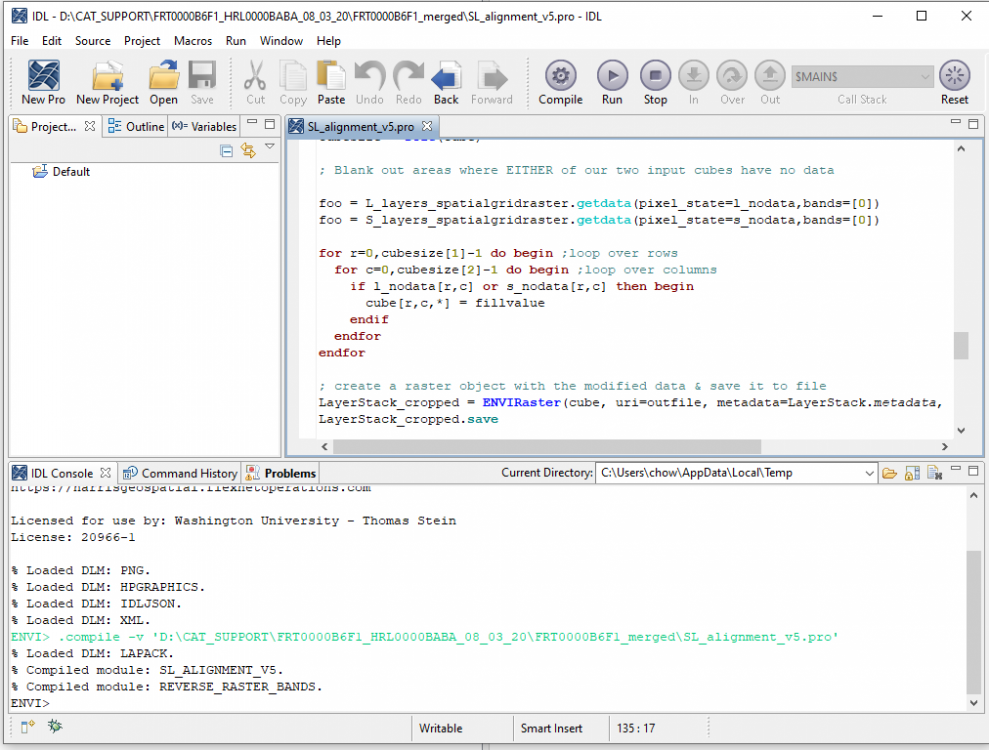
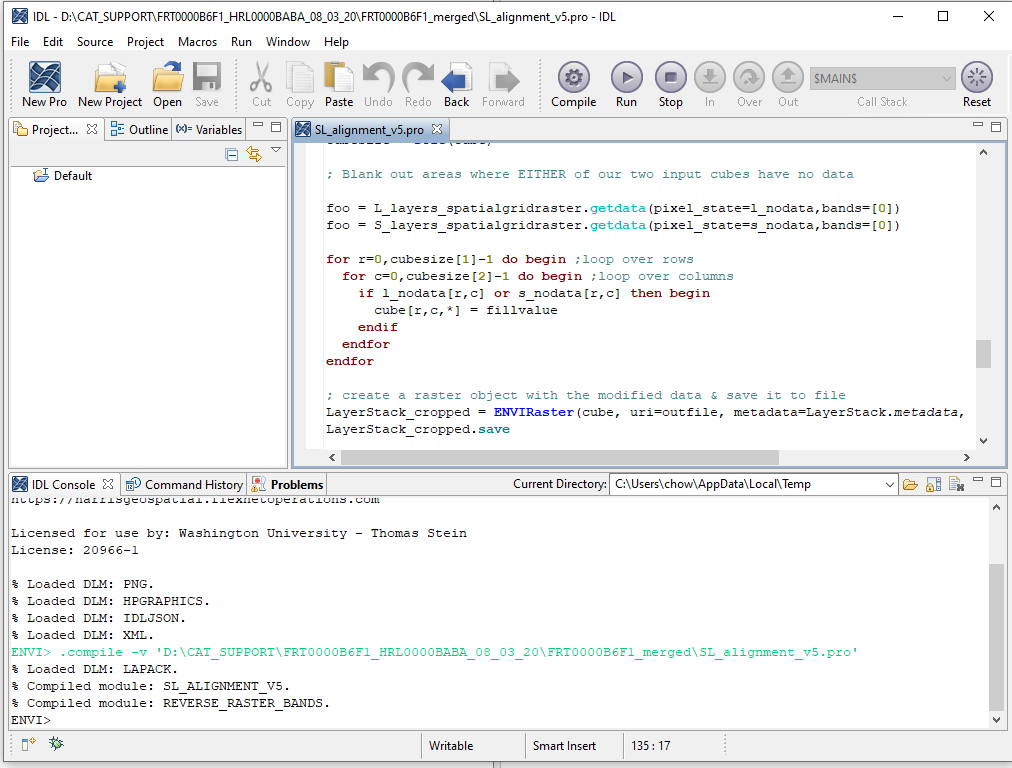
4, rename the attached SL_alignment_v5.txt to SL_alignment_v5.pro and open it in IDL, In IDL interface, click "Run', it will ask you select L cubes (results from step 3) , then select S cubes (results from step 3) and output the merged data. Now you have the data covers from 0.3646 to 4. You can select bands you need to export a subset data.
-
Hi Rochdi,
It shows your CAT is successfully installed (it is under Display Tab, CAT 7.4 not under the toolbox extensions) in the first recording you sent to me. You shall be able to use all CAT function. Please let me know if you have any problems.
Thanks,
Feng
-
Hi Rochdi: My timezone is Central Daylight Time (GMT -5). It's fine if we cannot go through virtual meeting. We can fix this issue via email communication. First I want to know several things:
What's ENVI version you are using? Are you using Windows or Linux? Would you please check the idl.pref file described in the instruction document?
Thanks,
Feng
-
Hi: This is Feng, I am glad to help you on the CAT issue. Based on your description, it seems ENVI doesn't recognized the CAT path. Once CAT is installed successfully, it won't show on ENVI toolbox but will be under the Display tab. We can start a zoom if you have a prefer time to solve this issue. Thanks
-
Hi: This is Feng, I am glad to help you on the CAT issue. Based on your description, it seems ENVI doesn't recognized the CAT path. Once CAT installed successfully, it won't show on ENVI toolbox but will be under the Display tab. We can start a zoom if you have a prefer time to solve this issue.
Thanks,
Feng
-
Hi Ralph,
I checked the same frame I processed two weeks ago. It seems I don't have the black strip.
What is the value at the black strip when you move mouse on the black strip using cursor value in ENVI? How big is the result file? Would you please resample it to small one and then send it to me with the header file?
Thanks,
Feng

Attempt to call undefined procedure: 'CAT_IMAGE_MOVE_EVENT'
in For data users
Posted
Hi Thomas,
CAT classic version was designed for ENVI 4.X version. Would you please using ENVI standard instead of classic?
https://pds-geosciences.wustl.edu/missions/mro/crism.htm
CAT will be under Display tab from standard interface.
Please let me know if you have any questions.
Thanks,
Feng