Rochdi
-
Posts
39 -
Joined
-
Last visited
Content Type
Profiles
Forums
Downloads
Blogs
Everything posted by Rochdi
-
Trying to merge S (VNIR) and L (IR) into one single cube image
Rochdi replied to Rochdi's topic in For data users
Hello Sir, Please I don't clearly understand your instructions above, I read about "New File Builder" from I3harrisgeospatial.com, but it doesn't include what you mentioned, they give only instructions about files of the same size. Rochdi. -
Trying to merge S (VNIR) and L (IR) into one single cube image
Rochdi replied to Rochdi's topic in For data users
Hello there, Please any help concerning my question? I'm trying to dedug the errors occurred in the code above but nothing seems to work as well as "New File Builder" and layer stacking tools. The first requires to have files that share the same size, and second tool gives inconvenient results. Looking forward to your reply, -
Trying to merge S (VNIR) and L (IR) into one single cube image
Rochdi replied to Rochdi's topic in For data users
Absolutely, I launched the process with "New File Builder" under "Raster Management", but the same error has occurred once I added the second cube (as been below). Any help?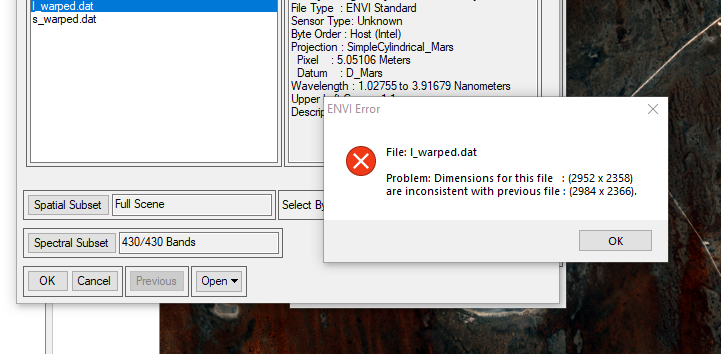
-
Trying to merge S (VNIR) and L (IR) into one single cube image
Rochdi replied to Rochdi's topic in For data users
I followed your instructions, but the following error has occurred: file: l_warped.dat Problem: Dimensions for this file: (2952 x 2358) are inconsistent with previous file (2984 x 2366) -
Hello There, I'm trying to merge the S (VNIR) and L (IR) into one single cube as discussed in the topic "Complete Near-infrared Spectrum" in the forum. I go along with the following steps: 1- Download the CTX covers the S/L cubes area in ODE (using Geotiff format CTX product). 2- In CAT, do map projection for both S and L cubes. 3- Register map projected S and L cubes to the CTX product by using "Image Registration Workflow". 4- Rename the attached SL_alignment_v5.txt to SL_alignment_v5.pro and open it in IDL, In IDL interface, click "Run', it will ask you select L cubes (results from step 3) , then select S cubes (results from step 3) and output the merged data. However, the code stops running and the following error has occurred: % Execution halted at: REVERSE_RASTER_BANDS 144 C:\Users\Rochdi Khalid\Desktop\in_progress\ritchey_analysis\draft\SL_alignment_v5.pro % SL_ALIGNMENT_V5 50 C:\Users\Rochdi Khalid\Desktop\in_progress\ritchey_analysis\draft\SL_alignment_v5.pro % $MAIN$ You help is much appreciated, Best. SL_alignment_v5.txt
-
That's what I did yesterday, thanks a lot sir.
-
That's it, but why when I extracted the spectral profile to a *.txt file, the file still include the default bad bands?
-
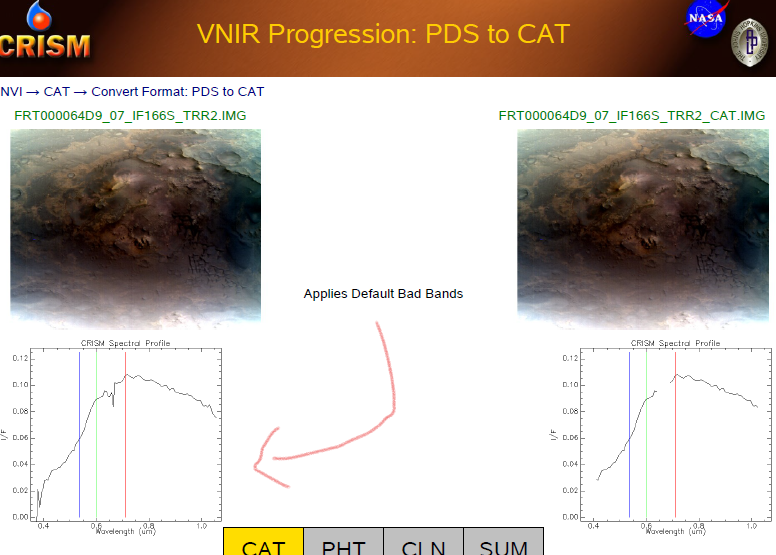
Hello Explorers, I want to make sure whether the default bad bands algorithm is already applied to TRR3 datasets or not. I noticed that in your useful doc "CRISM Data Users' Workshop Nili Fossae Data Processing Walkthrough". The example of (page 10) shows that before the S (VNIR) TRR2 cube being converted to CAT format, some bad bands have been detected at 0.4um and 0.7um as well while TRR3 version not, in this version it seems like the mentioned algorithm is already applied. If it's so, does conversion to CAT can affect on the future pre-processing analyses (I mean photometric correction, atmospheric correction, etc)? Look forward to your reply, Rochdi Khalid.
-
Hello Ray, I'm looking for DEM of the scene above. Is PDS Geosciences Node Data provide Digital Elevation Models of CRISM data? Your help is much appreciated, Rochdi.
-
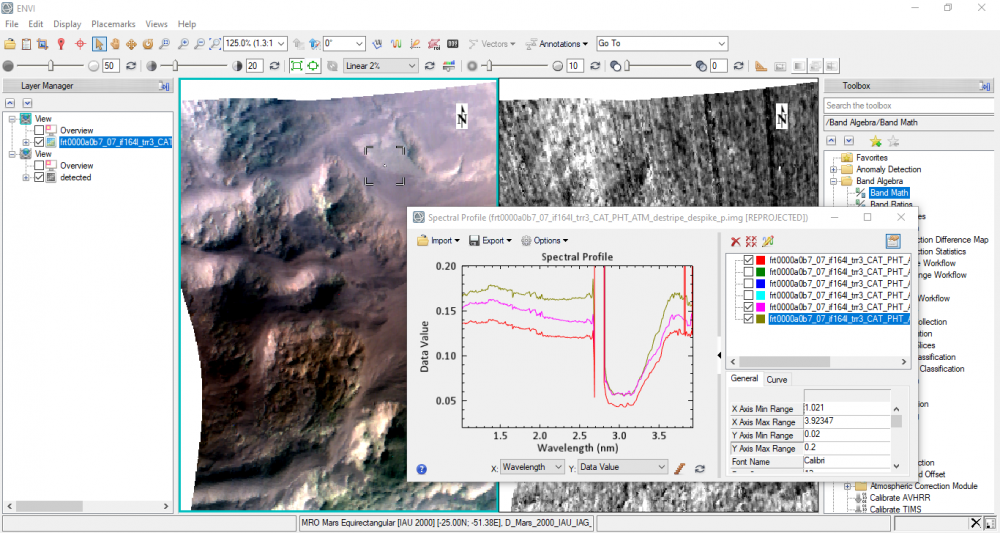
Thanks a lot, Ray. But I came up with this instead, I chose to create two views, one for the preprocessed TRDR data, and other for the spectral index map. Then, I link them together as seen below. Now, I can see the spectral profile of each pixel I clicked on.
-
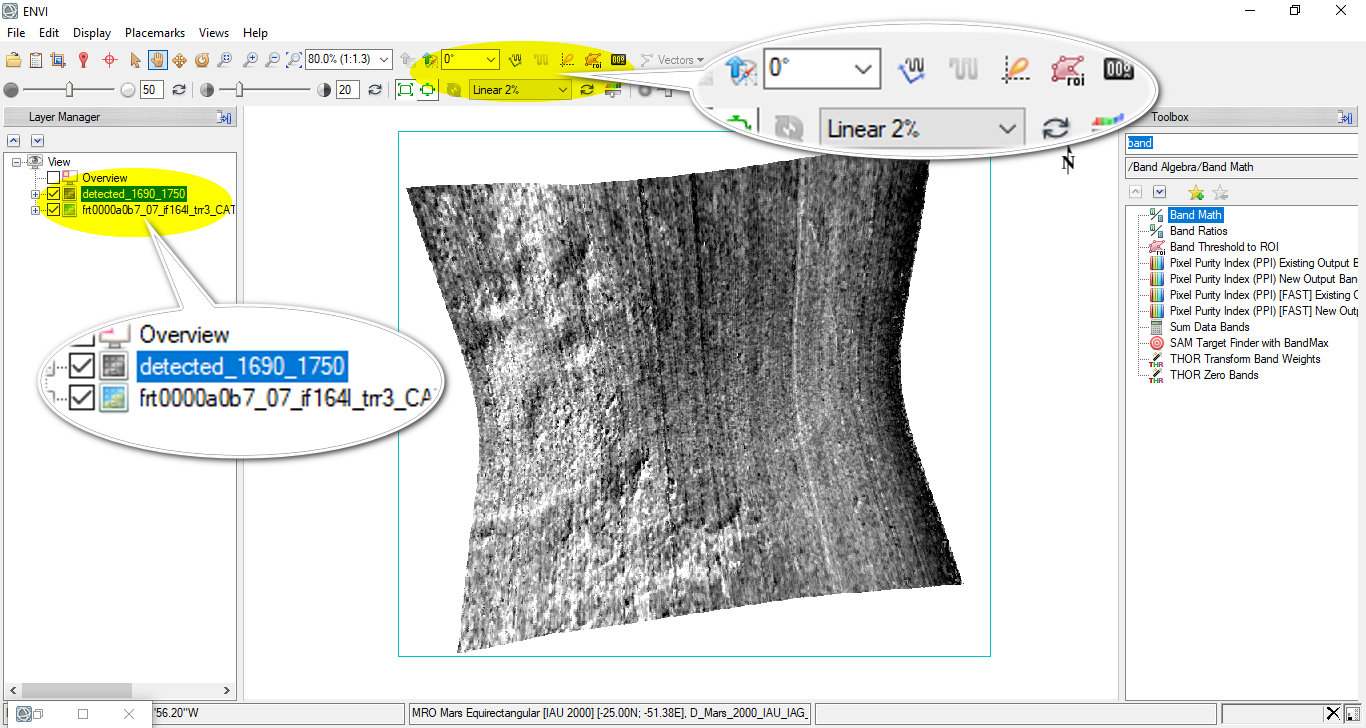
Thanks a lot, Sir. I still have another question, I used ENVI band math to calculate a certain index, the output shows a signle monochrome image as seen below. By using the mentioned output, I want to display the spectral profile of the bright areas, but the "spectral profile" icon in the ENVI toolbar is disabled, it gives only three options: arbitrary profile, horizental profile, and vertical profile. Does it occur because the displayed output is one monochrome band? if it's so, how can I fix this, please? Your help is much appreciated, Rochdi.

-
Thanks a lot, Now I'm totally sure about it. Please, I still have one question, is it necessary to flatten result after I do a band math? and what is used for?
-
Hello There, Just to make sure and to erase any doubts I have about the calibrated CRISM directories: TRDR: this CRISM contains hyperspectral targeted observations converted to units of radiance (I/F), divided into two spectral cubes VNIR (s) and IR (L). TER: this CRISM directory includes I/F hyperspectral targeted observations with a full spectral range (VNIR-IR), this directory has been corrected for geometric, photometric, atmospheric, and intrumental effects. MTRDR: Map-projected version of TER directory. Currently, I'm using TRDR directory in my research but I'm still wondering about the most recommended directory for mineral detection. Look forward to your reply, Rochdi Khalid
-
Hi Ray: Thanks a lot, that's what I did.
-
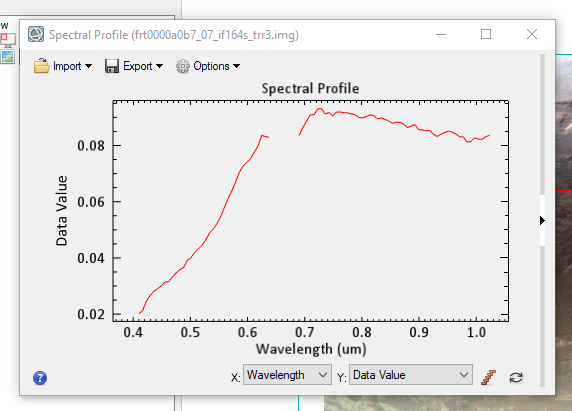
Hi Ray: the data I'm using includes IF in their label (frt0000a0b7_07_if164l_trr3 | frt0000a0b7_07_if164s_trr3). So, there's no need to convert them to IF. But is it okay to see "data_value" in Y axis instead of "I/F" while I display the spectral profile? Thanks.
-
Hello There, Should I do "Radiance to IoF" before I convert the PDS CRISM data to CAT? I'm asking this question because I want to analyze the spectral profile of a mineral on Ritchey crater using CRISM L cube data, but I noticed the Y axis missed "I/F" as highilighted in your docs. The graph axes are the following: -> X axis: Data Value -> Y axis: Wavelength (um) Do I really need to apply "Radiance to IoF" first? is this like a "Radiometric Correction" to PDS CRISM data? I used to do this, but an error has occurred said: "The input data is not a radiance" Your help is much appreciated.
-
Hello Sir Ray Arvidson, Sometimes I ask stupid questions, but I extracted the spectral signatures of those bright areas. Thanks a lot for your tremendous help Sir Ray, and thanks to Jennifer G. Ward for the mentioned paper. Rochdi.
-
That's it, Sir Hope I'm not bothering you, as you know the L (IR) cube is already converted into IOF. If I want to extract the spectral signature of these bright areas which highlighted in the output above, could I use CAT toolkit for this purpose? or just a tool from ENVI toolbox?
-
Alright, then. Concerning other indices which have different reflectance values compared to L cube bands values. In this case, Can I assign the bands which are closest to the reflectance values of those indices? Rochdi.
-
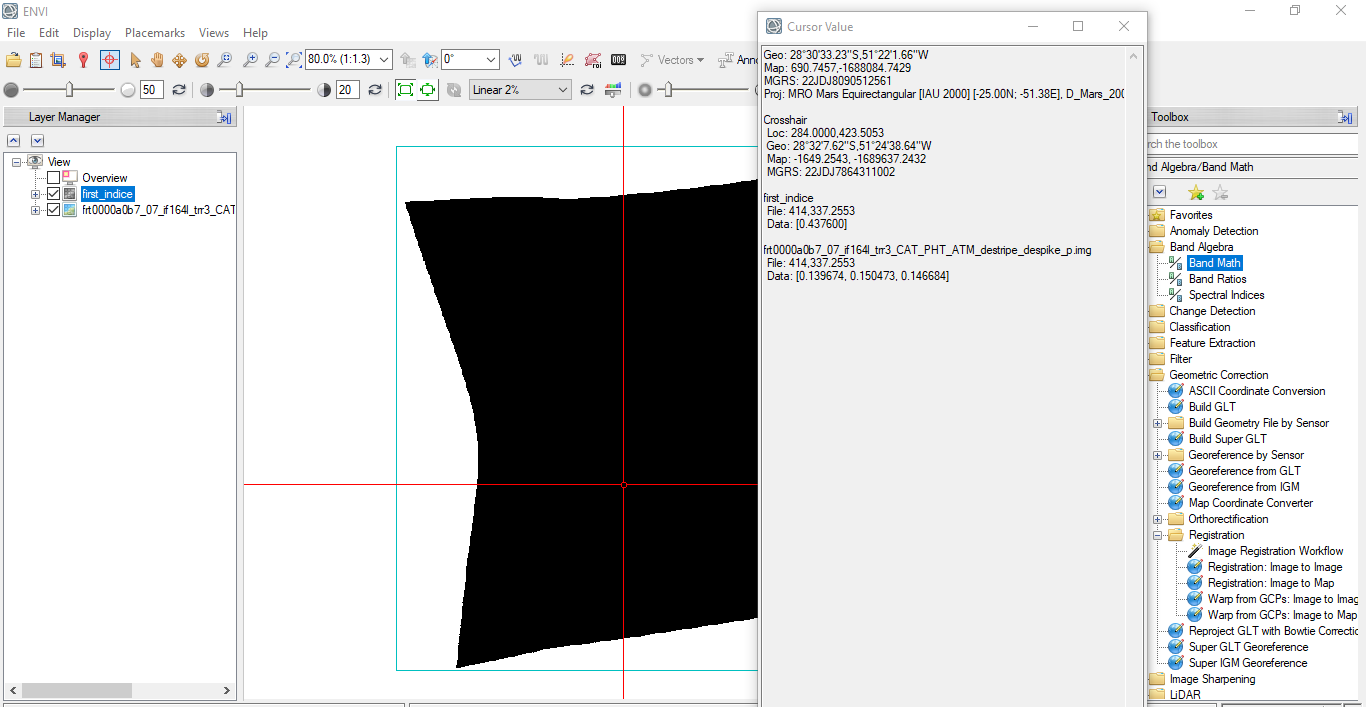
So, is the result I got above is the expected one?
-
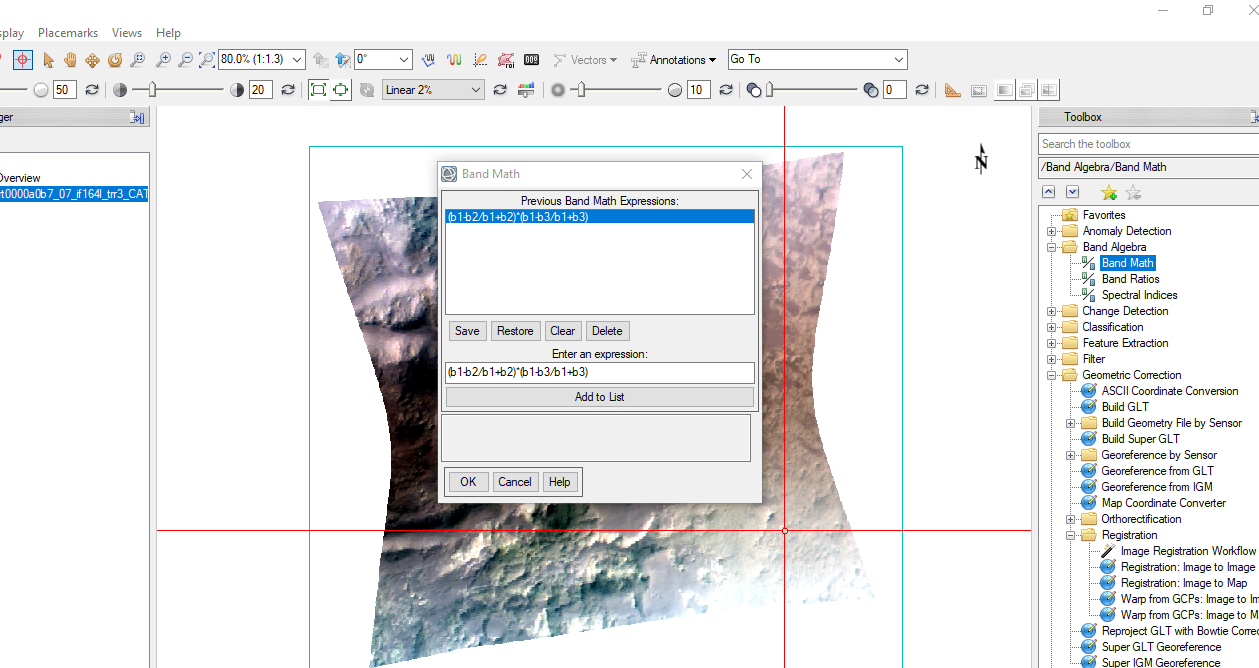
Yes, after I read the documentation for how to represent algebraic expression on ENVI Band Math function. I realized that I need to modify the equation by adding float in the dominator as follows: HCPINDEX: ((float(b1) - float(b2)) / (float(b1) + float(b2))) * ((float(b1) - float(b3)) / (float(b1) + float(b3))) I come with this attached output result below. So, where's Pyroxene, then? or the result should be in three color compsites?
-
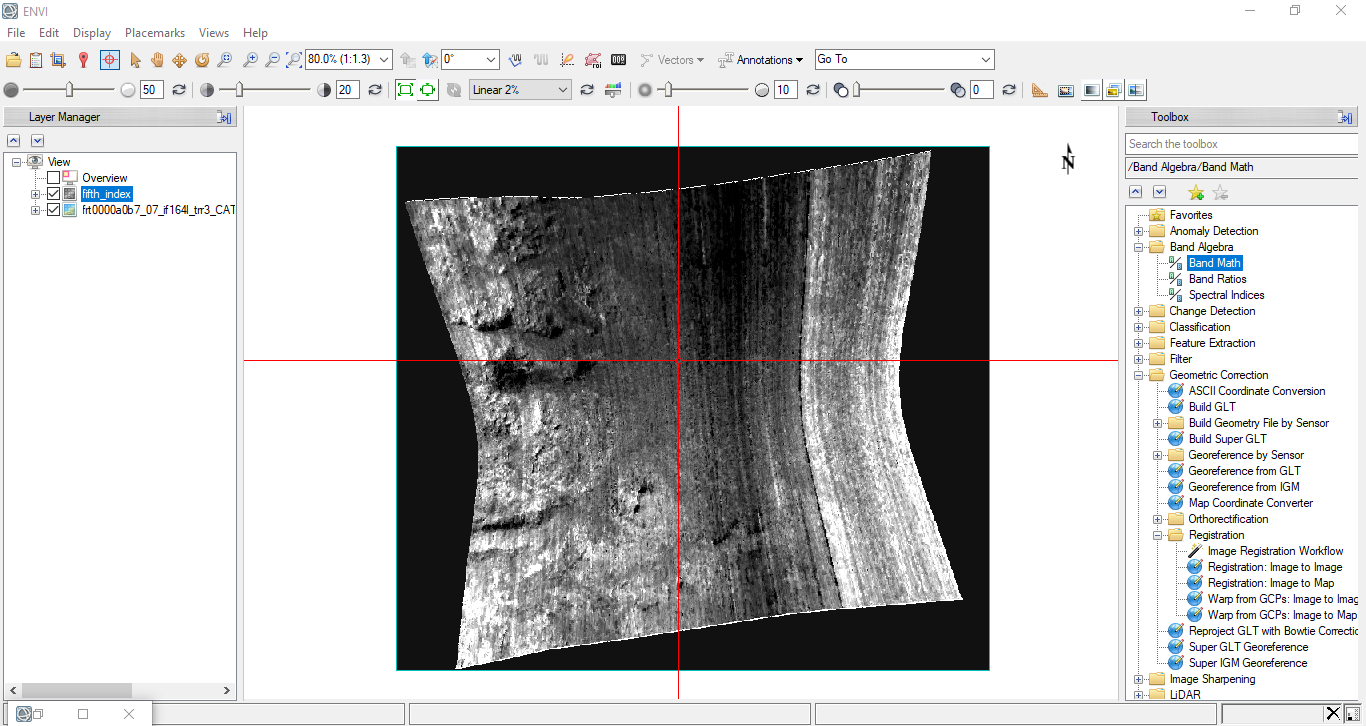
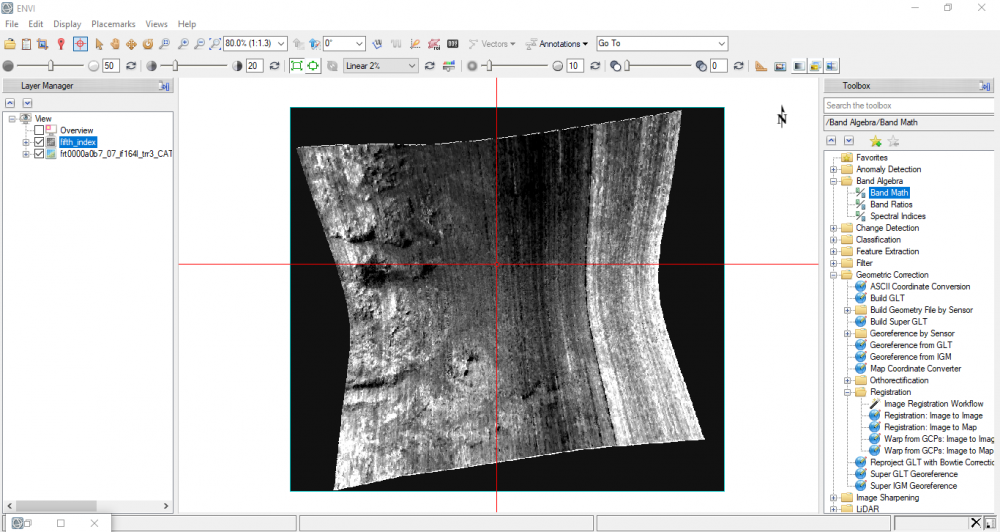
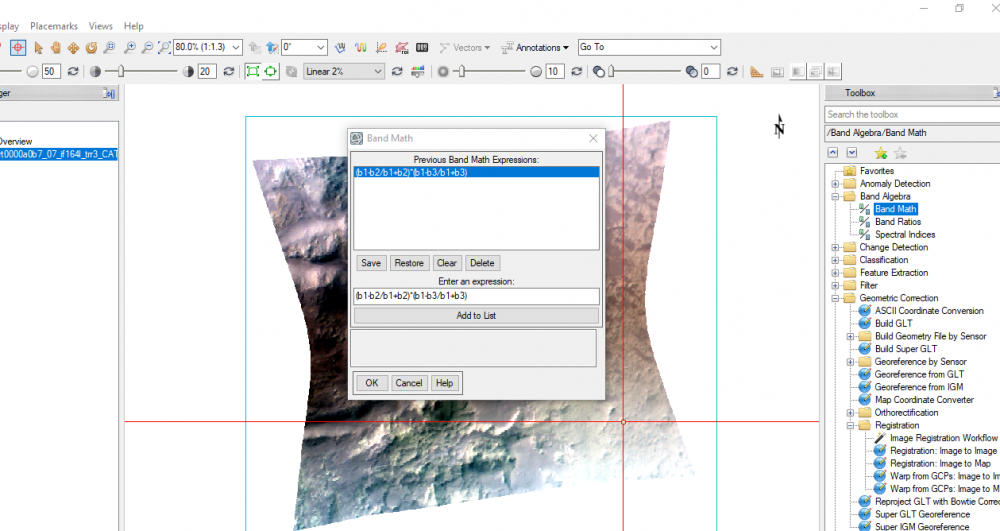
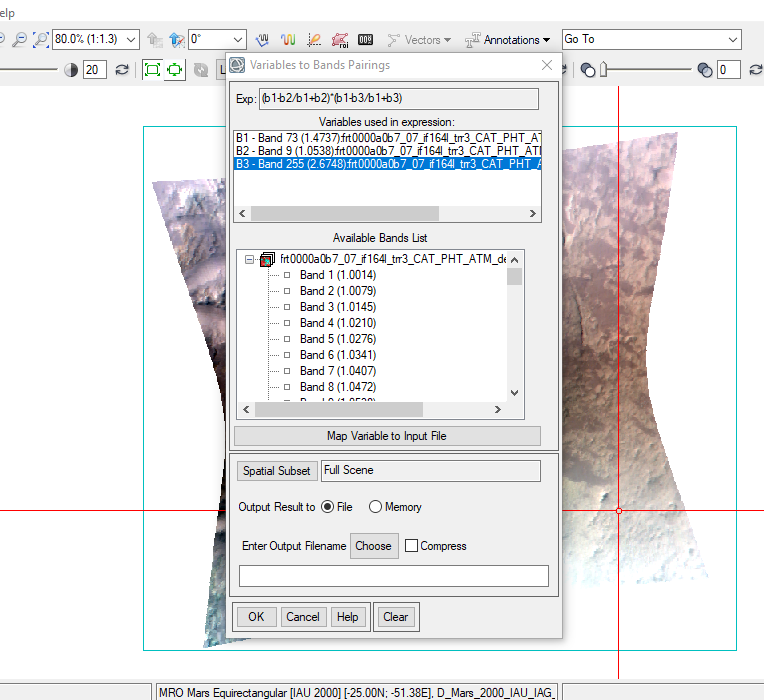
Hello Sir Ray Arvidson, Thanks a lot, that's what I thought before. I used the ENVI tool you mentioned, I tried to write the formulation of HCPINDEX just to learn. HCPINDEX: (R1470 - R1050/R1470 + R1050) * (R1470 - R2067/R1470 + R2067) As I wrote the expression, I refered R1470, R1050 and R2067 to b1, b2 and b3 successively (X1.png). Then, a new window popped up to assign the variables (b1, b2 and b3) to their specific wavelengths. The following is the bands that I assigned to the variables (X2.png): b1 (R1470nm) => Band 73 (1473, 7nm) b2 (R1050nm) => Band 09 (1053.8nm) b3 (R2067nm) => Band 255 (2067.4nm) However, I come up with this unexpected output result as seen below (X3.png) Is something went wrong?

-
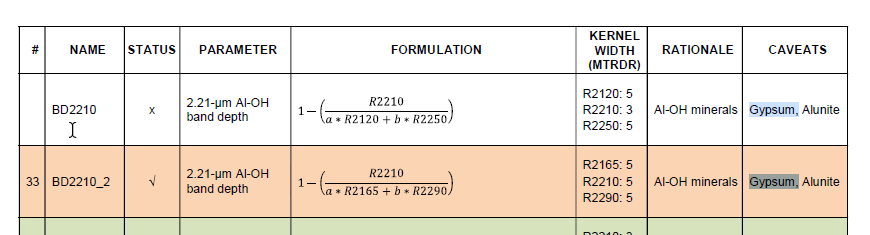
Hi Jennifer, Thanks a lot for the attached paper, I found it useful for my Master thesis I'm working on. However, the mentioned indices above are still unclear to me for putting them into action. What I'm wondering about is these questions: Does R2210 mean reflectance at 2210nm? Do I need a value to assign it to R2210? if yes, could I use ENVI and CAT to get R2210 value, for example? I look forward to your reply, Rochdi.
-
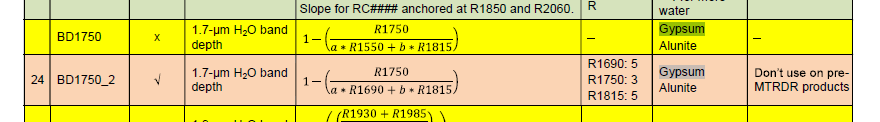
Hello Experts, I would like to learn how to calculate some indices to detect Gypsum and other minerals on Ritchey crater, I decided to start first with the formulations included in "CRISM Data Product Software Interface Specification" (as seen below) to seek out gypsum. However, I didn't clearly understand the syntax of the mentioned formulations, I mean (R, a, b ... etc), I found these formulations more detailed compared to the indices I've calculated before such as NDVI, EVI, SAVI ... (using Landsat8, Spot imageries). Would you please explain to me the syntax of these formulations and what do I need to get started with before diving into this process? Look forward to your reply, Rochdi.
-
My thanks and appreciation to your help Sir Ray Arvidson .