

Wladimir Acevedo
-
Posts
14 -
Joined
-
Last visited
Content Type
Profiles
Forums
Downloads
Blogs
Posts posted by Wladimir Acevedo
-
-
15 hours ago, June Wang said:
I am not quite understand your question. Do you like to know how to give a 3D view? I saw your overlain of the CRISM onto a CTX. If you overlain all the images onto a DTM, and change the terrain exaggeration factors, you will see something like above figures from different points of views.
HiRiSE DTM has much higher resolution than the DTMs from HRSC and MOLA.
Map resolution for a HiRISE image is about 25cm/pixel, and the HiRISE DTM is about 1m/pixel.
HRSC DTMs have various resolution from 50m/pixel to 400m/pixel. Most of the products are at the resolution of ~50m/pixel, 75m/pixel, and 100m/pixel.
MOLA DTM is about 500m/pixel.
CTX image is about 6m/pixel. And FRT CRISM data are about 18m/pixel.Depending on your needs, the higher resolution of a DTM, the more detailed features the terrain can represent.
Thank you so much for your support June, now I can picture more clearly the general panorama. A remaining question would be about the process of create a "layer" from the CRISM image (using a browse product?) with only the "painted" pixels which represents the main mineralogy from a particular scene, as the maps who I've attached on the previous answer. Is there an automatized method to do is or maybe I should use a photo edition software to clean the images from the "black pixels" and create a layer with only the "colorized pixels"?
Thanks,
Wladimir
-
2 hours ago, June Wang said:
Hi Wladimir ,
ENVI 5.3 would also work for you. Please have a try.
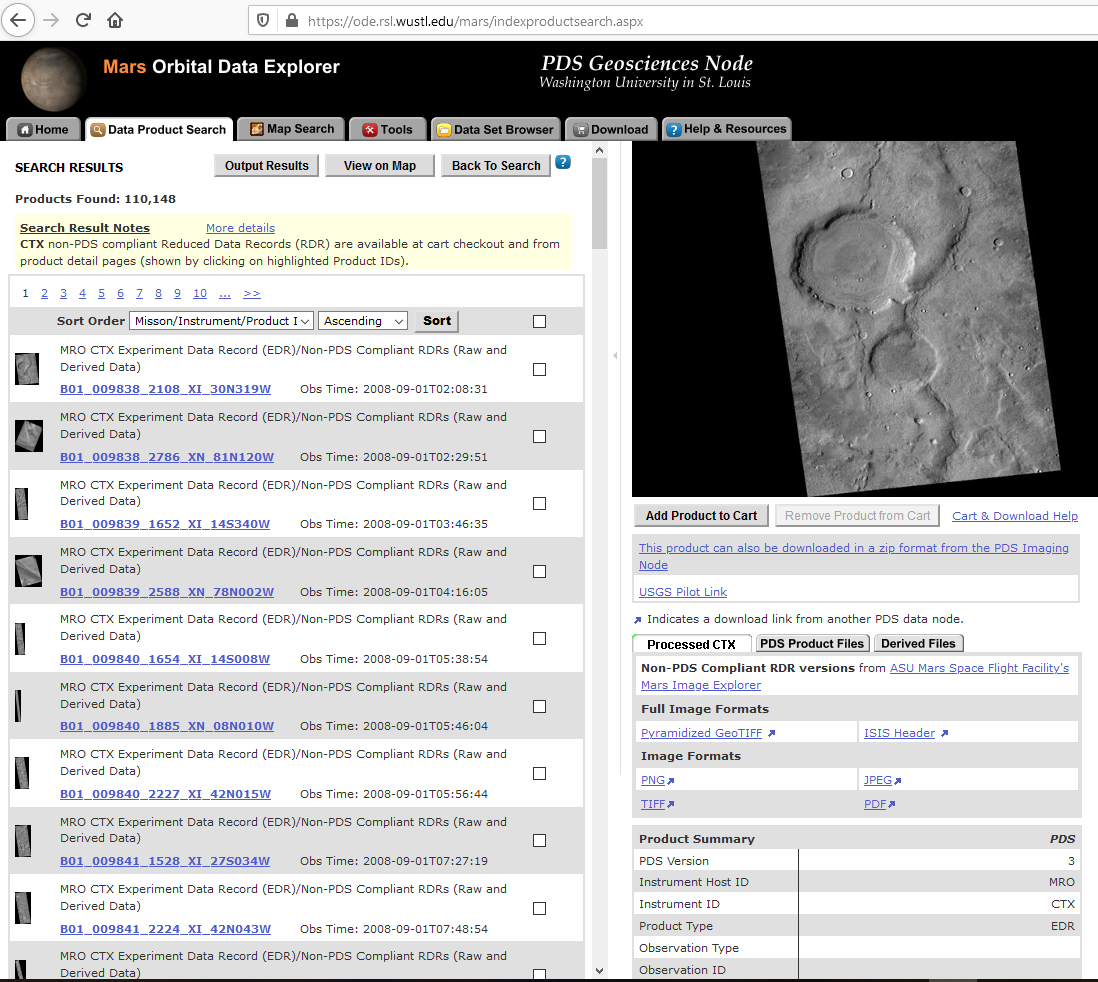
You can search for CTX EDR and Non-PDS Compliant RDRs through Mars ODE (https://ode.rsl.wustl.edu/mars/indexProductSearch.aspx) as shown in the attached fig1.
In the data search results page (fig2), you can download the 'Pyramidized GeoTIFF' under 'Processed CTX' panel on the right. The Pyramidized GeoTIFF image has spatial reference information included in the image header.
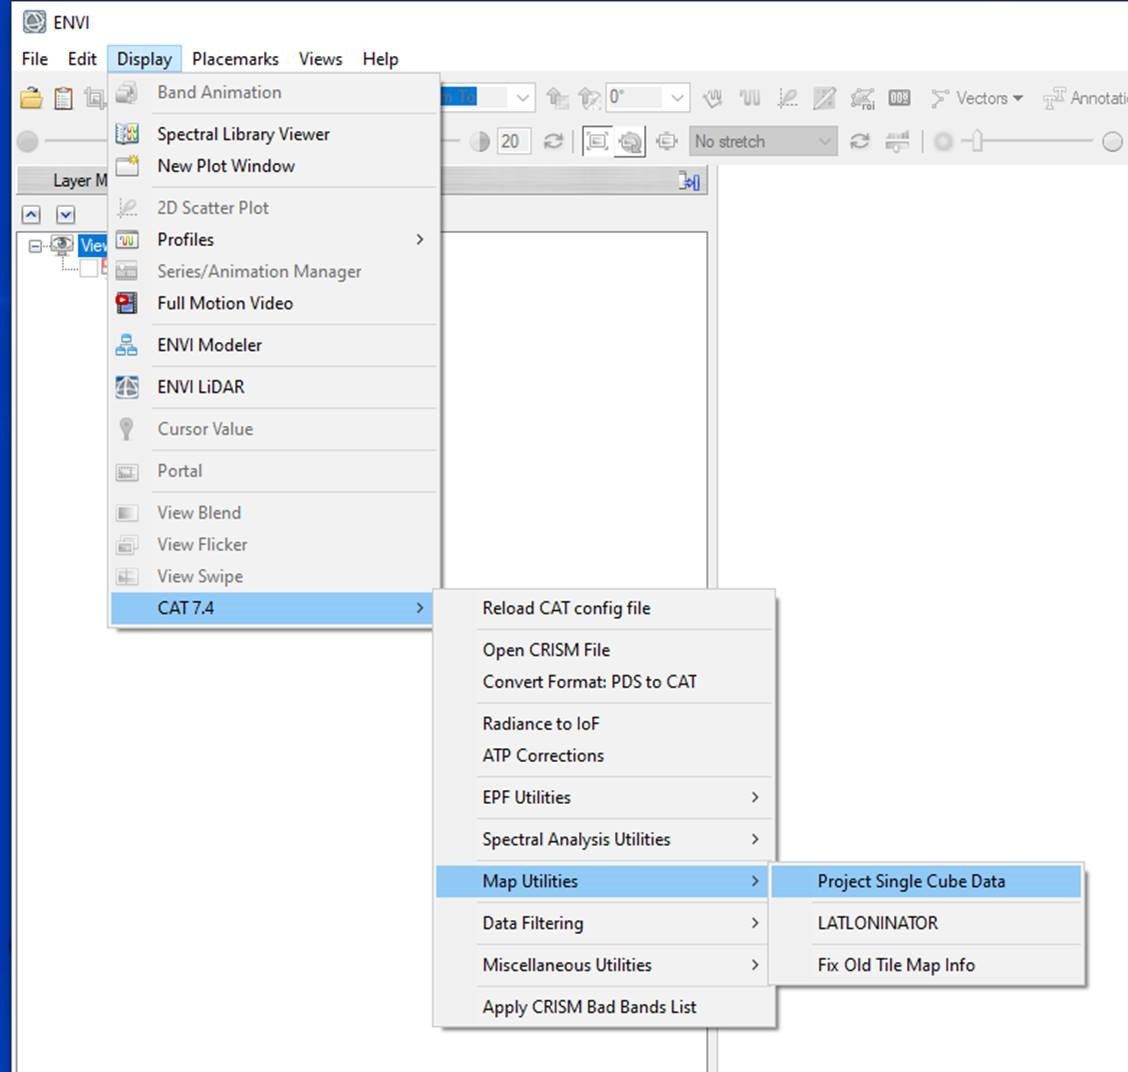
You can export a map projected CRISM image using the CAT menu function as shown in the fig3. The CRISM output can be overlain with the CTX RDR in ArcGIS. Please let me know if this doesn't work for you. Thanks,
JuneFig1
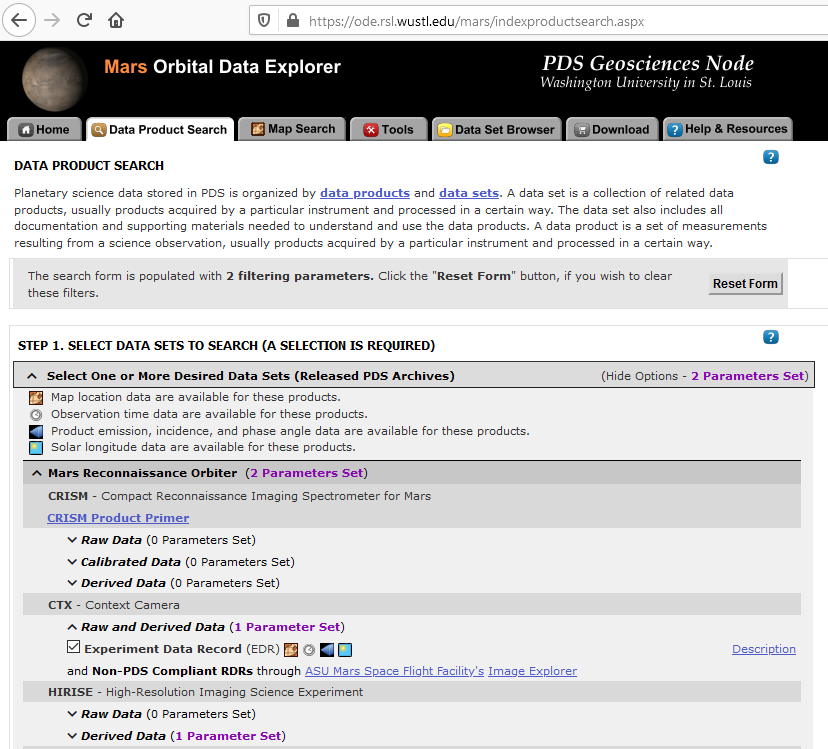
Fig2

Fig3
Hi June,
I followed the steps that you indicated to me, and I've got this:

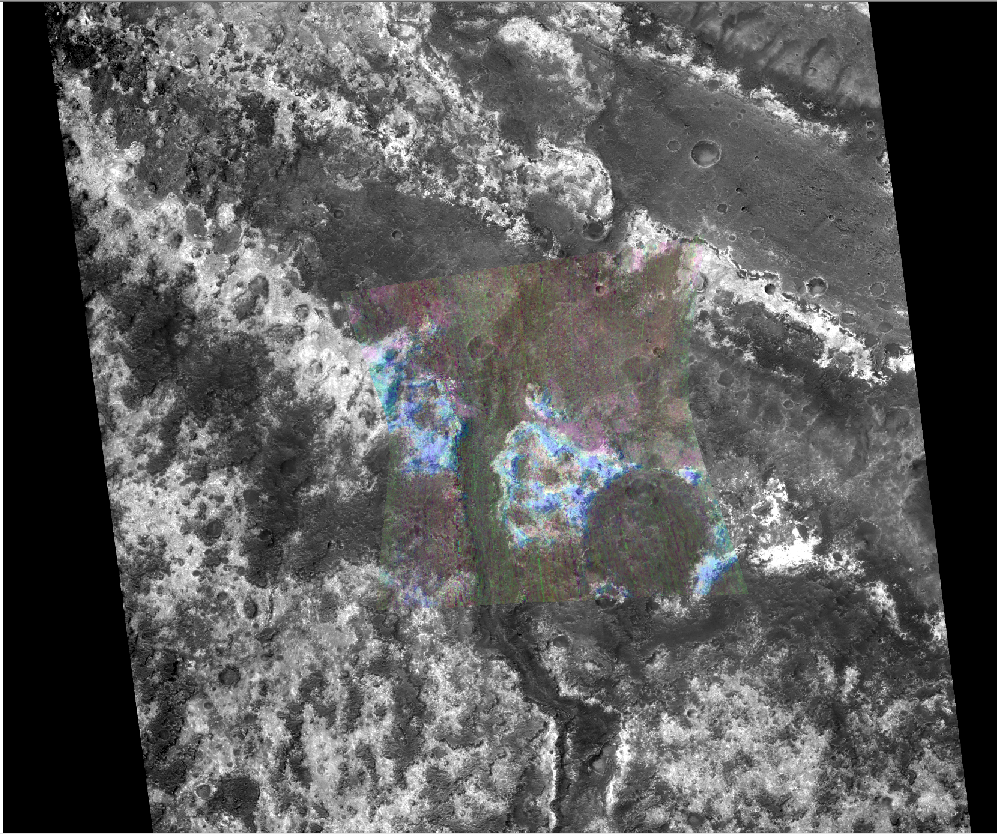
Is the frt00003bfb_07_if166j_ter3 product charged with the PHY browse product (I've created frt00003bfb_07_if166j_ter3_2014params archive with CAT) over the D17_033826_2027_XN_22N018W CTX image.
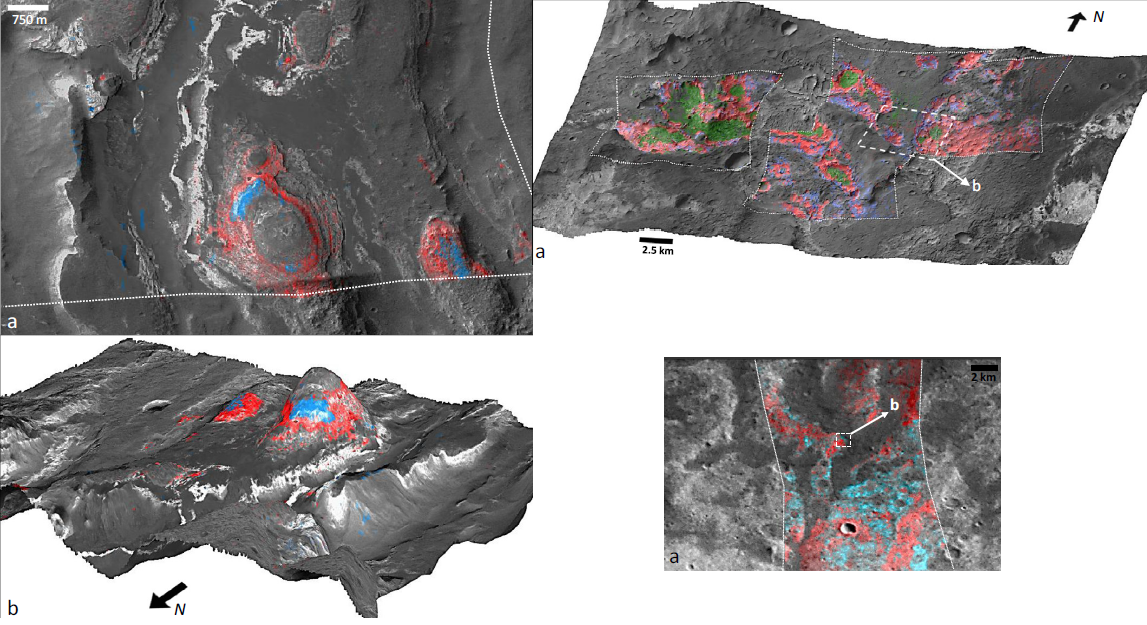
Looks very raw, but finally I'm moving forward, thank you. Nevertheless, what I'm looking to produce is something like this (images from Carter, 2015)
 :
:
What procedures do I need to follow to obtain similar results?
Also, I've notice that the HiRiSE DTM are very limited in quantity and spatially. If I need a 3D model of the surface where a DTM isn't available should I use a HRSC or MOLA product?. Do they work similar to a DTM?
Thank you so much,
Wladimir
-
On 1/3/2020 at 4:39 PM, June Wang said:
Hi Wladimir ,
You can download non-PDS Compliant CTX RDR data from Mars ODE(https://ode.rsl.wustl.edu/mars/indexProductSearch.aspx) or from ASU Mars Space Flight Facility's Mars Image Explorer (http://viewer.mars.asu.edu/planetview/inst/ctx/#T=0) directly. Those CTX RDR data are map projected and could be overlain with the HiRISE DTM. ArcGIS can project the data on the fly if they have different projections. I can also help if you need more assists on data registration. Thanks,
JuneThank you June. Do you refer to the EDR CTX products?. I'm using ArcScene trying to overlain the CTX images on a HiRISE DTM model but I don't know how to do this with a CRISM image. Also, do yow know how to create a mineralogical map from the CRISM cubes?. I'm trying to export the summary parameters custom stretched images, but sincerely, I don't have idea how to this in a right way.
Any help will be very greatful, thanks.
Wladimir
-
On 1/3/2020 at 4:08 PM, Ray Arvidson said:
Wladimir: I suggest you use ENVI 5.5.2 interface and upgrade to CAT 7.4. You can use the flatten function in CAT to suppress column dependent striping. And with ENVI 5.5.2 it is easy to co-register CRISM images with CTX or HiRISE images. Let me know if you have these versions of ENVI and CAT. The CAT 7.4 is available from our PDS web site. https://pds-geosciences.wustl.edu/missions/mro/crism.htm
Ray Arvidson
PDS Geosciences Node Manager
CRISM Team Member
Thank you for your response Mr. Arvidson. Unfortunately, I only have access to the 5.3 version of ENVI software, so I would need a method using that version or Arcmap. Nevertheless, the flatten function seem to work well with the striping problem.
Another question that I have is how much is necessary apply the "empirical corrections" for a TRDR product?. I mean, It is enough a standard corrected (atmospherical, photometric) TRDR product to analyze or I have to try to convert this on a "TER type product" through geom. normalization and spectral smile correction to analyze properly a scene?.
Any help will be very appreciated.
Thanks,Wladimir
-
Hi all,
as the title says, how can I remove in a simple way (I wish) this artifact from CRISM cubes?. I'm working with ENVI and CAT, but I'm not an IDL user, so if there exist a simple way to did it, would be really great.
Also, how can I project a CRISM mineralogical map into a CTX image and into a DTM (HiRISE) terrain model?. I'm trying with ArcScene but it seems that it is possible with ENVI too.
Thanks,
Wladimir
-
Hi community,
I'm working with ENVI 5.3 + IDL coupled with CAT 7.4 trying to process TRDR images (.trr3). I'm based primarly on the CRISM data processing workshop from 2012 and 2017 and my worksteps are as follows:
1.- Apply the ATM corrections with CAT to the images
2.- Apply de map projection fo the image
3.- Obtain the summary parameters imageNevertheless, I have certain doubts about this, so I would be very grateful if you can provide me some help please. My questions are:
- Should I obtain the summary parameters and then apply the map projection or it is the opposite?
- It is necessary the "ratioing" for the spectra and use the "Flatten summary parameters" option?. I've seen a post where its says that is enough the "Continuum Removed" option
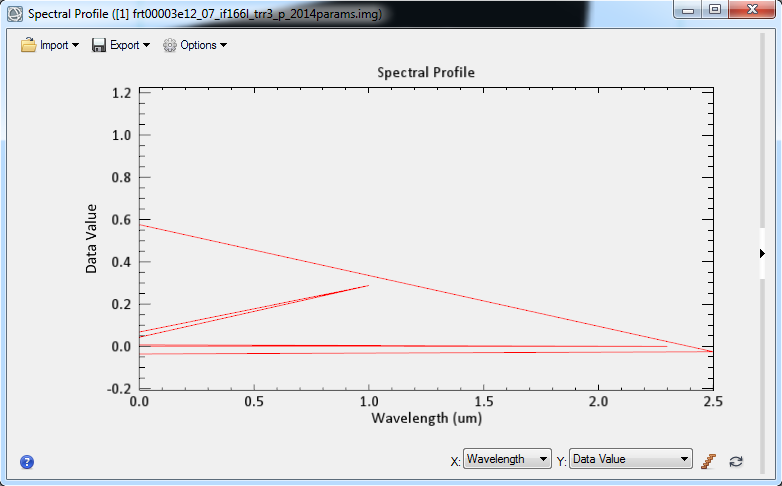
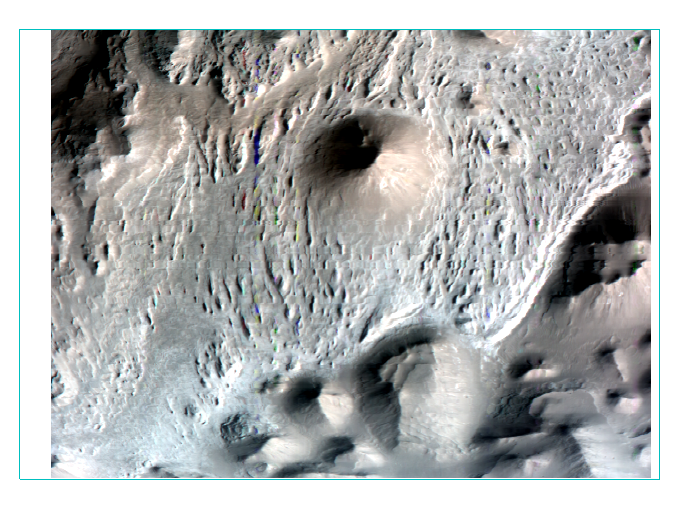
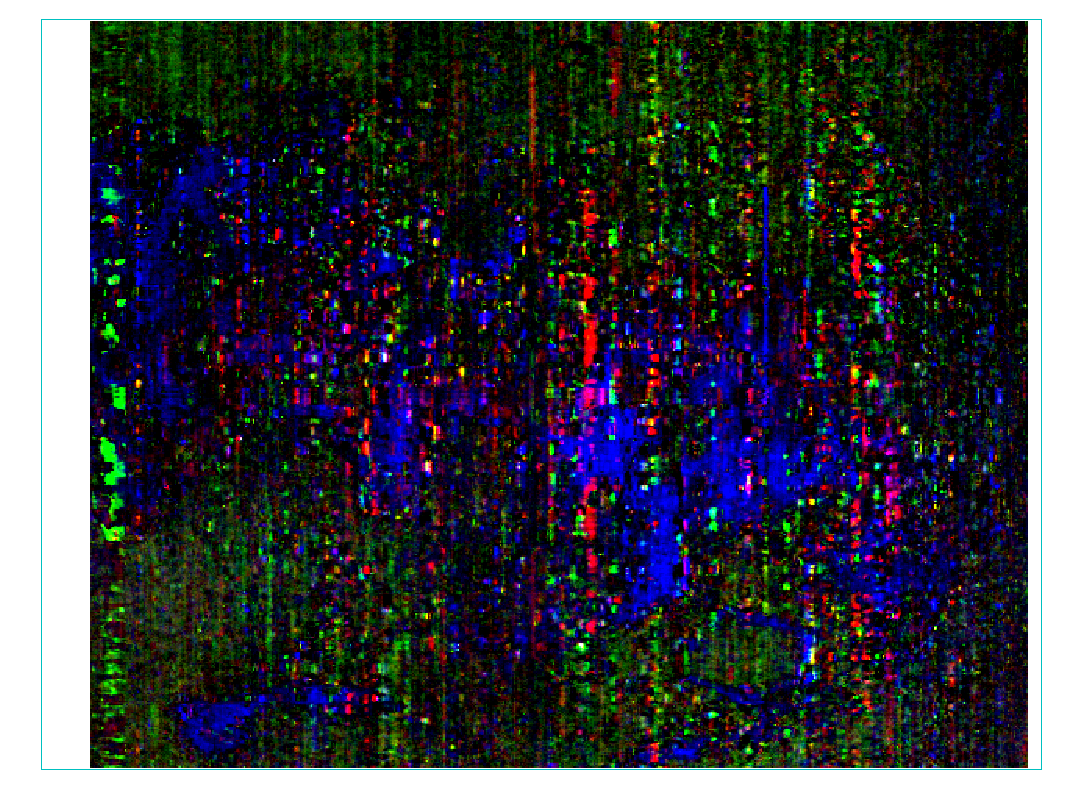
- How can i obtain a better resolution for the summary parameters image?. I've seen very good resolution images from papers that doesn't look like what I have obtaining (img_1)
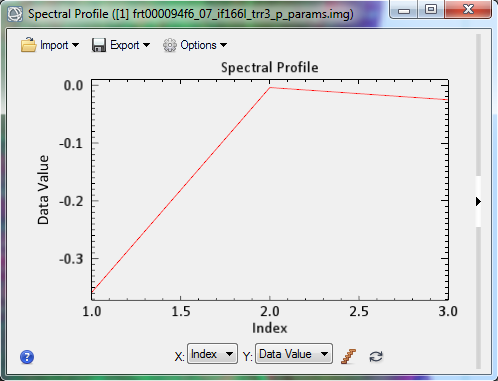
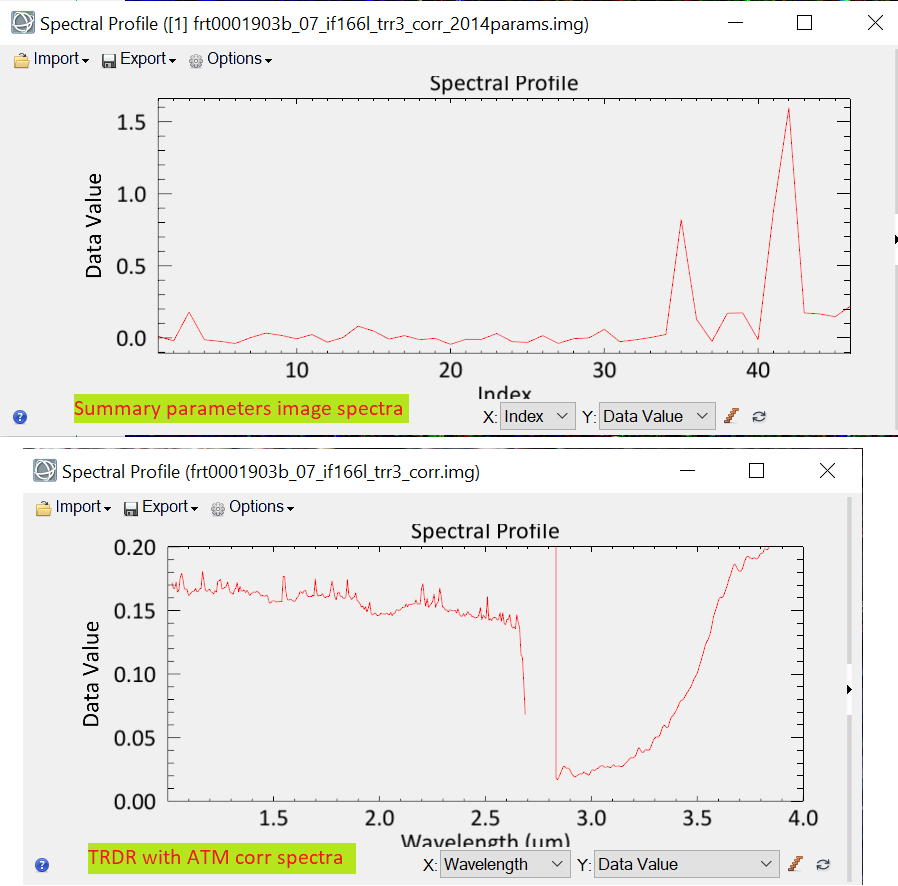
- When I create the summary parameters image the spectra doesn't look like the TRDR pure image because the data values change. Does that mean that I have to use the spectra from the TRDR and the summary parameters image is just like a "color guide" fot the mineral phases? (img_2)Finally, how can I use the summary parameters properly and elaborate mineralogical maps from they?
Any help will be very appreciated, thank you.
Wladimir
wladimiracevedo@udec.climg_1: The resolution that I'm getting from the summary parameters image after the custom stretch

img_2: Spectra for the summary parameters image vs the original TRDR corrected image from the same pixel on both.

-
On 6/17/2019 at 5:05 PM, Feng said:
Hi Wladimir,
Would you please provide the scenes you worked on so that we can better go through from there?
Thanks,
FengHi Feng,
Some of the scenes that i've checked are:
FRT000064D9_07_IF166J_MTR3
FRT000064D9_07_IF166J_TER3
FRT00009786_07_IF165J_MTR3
FRT00003E12_07_IF166J_MTR3
FRT00003E12_07_IF166J_TER3
FRT00008389_07_IF166J_MTR3
FRT000094F6_07_IF166J_MTR3
FRT0000634B_07_IF163J_MTR3
HRL000119C7_07_IF181L_TRR3The big part of them were on the MICA files, i've tried to replicate the results from there as a starting work since i have not much expertise with this kind of data treatment.
Thank you,
Wladimir
-
On 6/19/2019 at 8:47 AM, Ray Arvidson said:
Hi there: Would you please let me know which MTRDR scene you have been examining and I will take a look at the data and spectral plots and then answer your questions.
Ray Arvidson
PDS Geosciences Node Manager and CRISM Science Team Member
Hi professor Arvidson,
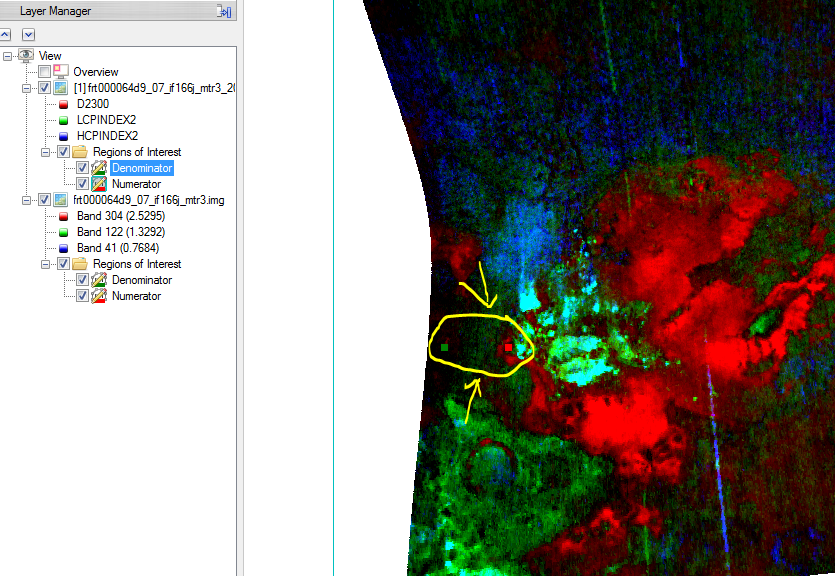
The exact scene product is the: FRT000064D9_07_IF166J_MTR3. I've tried emulate the results from the MICA files example, but without success.
This image shows the ROI's location for the numerator (X:174, Y:529) and denominator (X:110, Y:529).
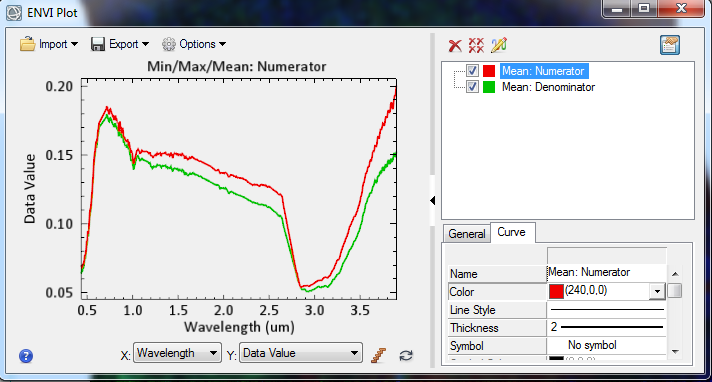
This second, the mean spectra for the numerator and denominator:
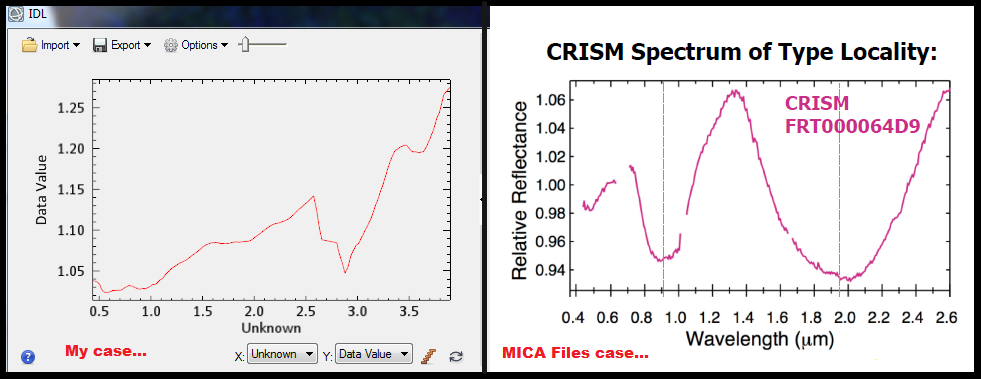
And this is the resulting spectra (smoothed) from the ratioing process, which is pretty different from the MICA files example:
Any advice for the procedure or if you detect something wrong will be very helpful.
Thank you so much,
Wladimir
-
Hi dear community,
I'm working primarly with MTRDR products for mineral identification using ENVI 5.3 + IDL with CAT 7.4 coupled and i have some questions:
1.- Why when i visualize the spectral profile for some scene in any pixel the profile shape is essentially the same only with changes on the data value?. Does that mean there's only one dominant phase per scene?. Even when i use the Browse Products and can distinguish more than one phase (colors) the profile for the default image (true color) keeps its form. I don't know if this is a coincidence for the scenes that i've analyzed or there is something wrong on the procedure that i'm following.
2.- It is enough the interpretation with the continuum removed function or the ratioing process is necessary?. I consider that isn't an easy task find an appropiate denominator ROI. I've tried to emulate some examples from the MICA files but i did not get the same results.
3.- About the custom stretching for Browse Products, when is neccesary fix the minimum value distinct to zero?. I understand that the maximum generally must be thw 99th percentile of the histogram, right?.
4.- How must be selected the right summary parameters for the "Custom Products" when the "Browse Products" are not good enough?
Any help for any question will be very well received, thank you.
-Wladimir
-
Hi Feng,
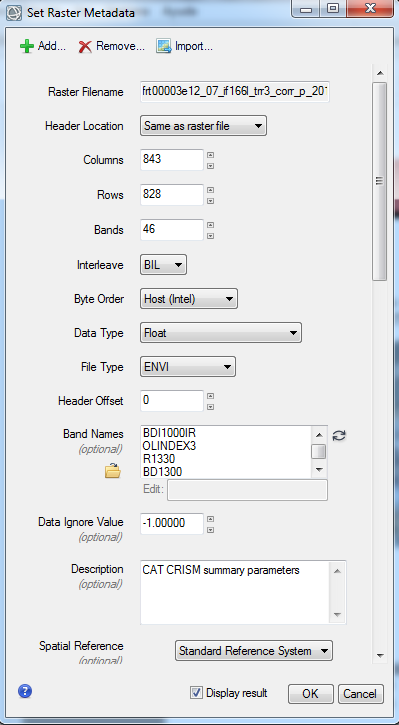
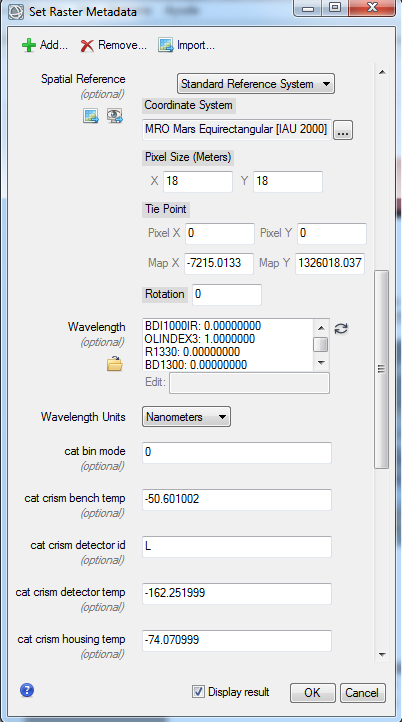
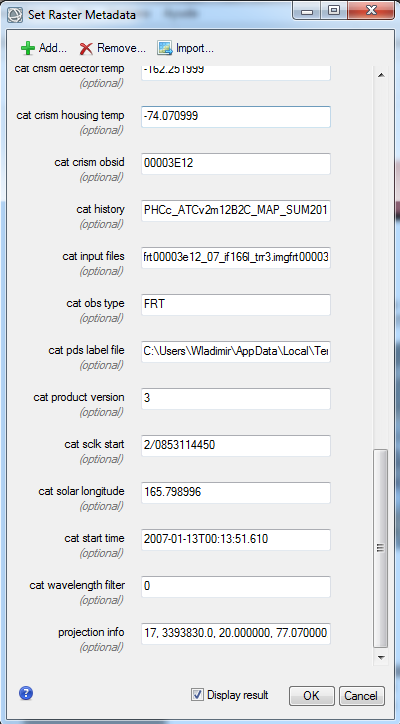
I have reprocessed the image and still happening the same, even with others products that i have tested too. I have noticed that the data ignore value has changed to -1.0000 but i can't reset the 65535.0 default value. I'll leave you the information of the metadata of the image in case you see something different from yours.
Thanks,
Wladimir
-
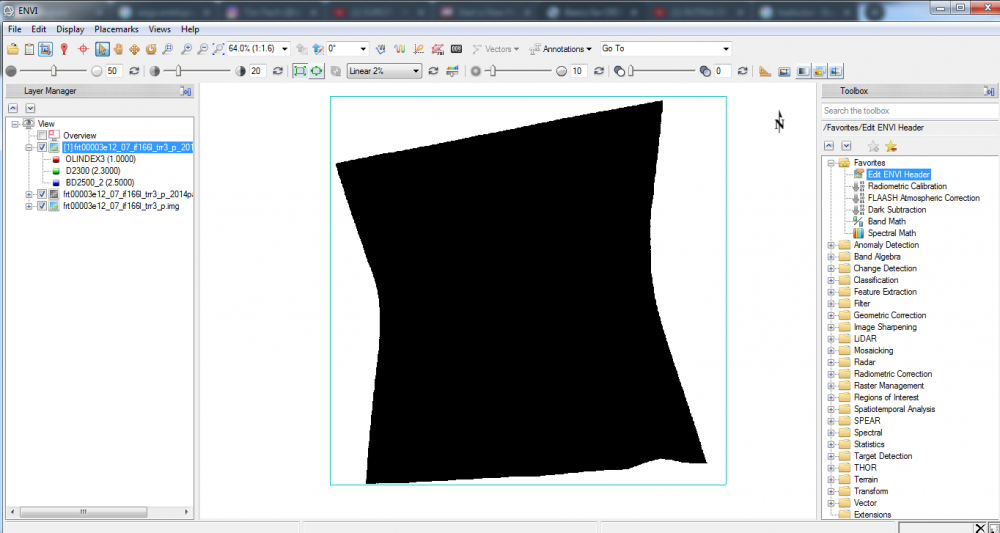
Hi again Feng,
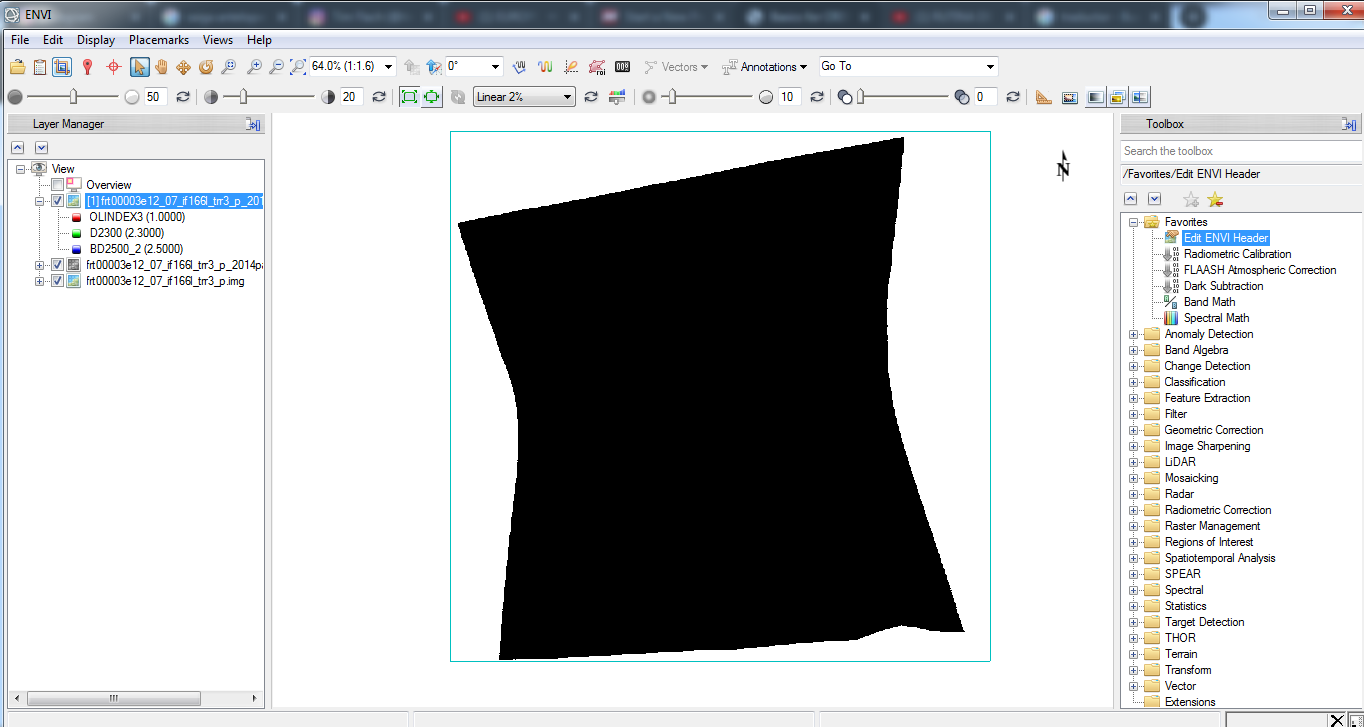
I have tried the method that you showed for the wavelenght problem, but when i display the results the whole new image appears in black (img_1) and i don't know how to manage this in order get a right image again. Is this method correct for a browse product image (i.e. R: OLINDEX3. G: D2300, B: BD2500_2)? and how i know what it's the right wavelenght for any of these parameters?. I have used 1.0, 2.3 and 2.5 μm, respectively, based on yout example and looking on the Viviano-Beck et al., 2014 paper. It is right?. Also, when i display the new spectral plot it shows like img_2. What am i doing wrong?
In addition to this, i have a question about the atmospheric and photometric correction. Are the TRDR and MTRDR images already corrected?.
Thank you again,
-Wladimir
-
Hi Feng,
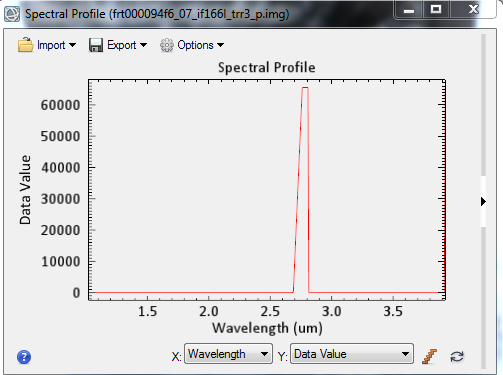
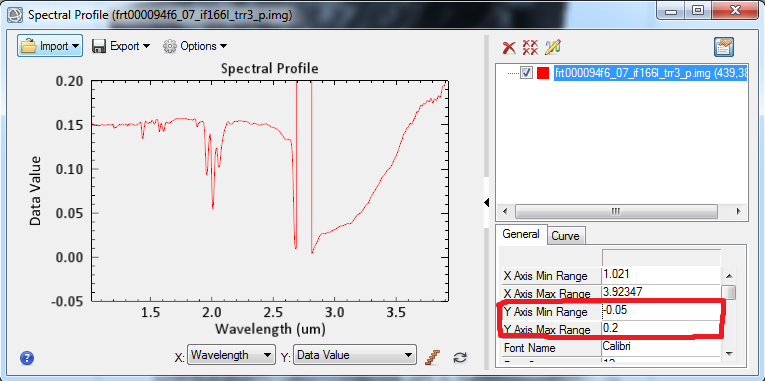
First of all, thank you for your answer, it solved my first question. Nevertheless, i'm facing a trouble with the spectral profile view (img_1) due to a supposed high value of the data, so i have to manually change the Y axis range to see the spectra correctly (img_2). Why this happens?. because i'm understand that the value of 65535 is for the "wavelenghts" but it seems to interfere on de "data" values even being ignored oh the metadata of the image. Also i could not find a way no ignore some bands like you told me. Or am i misunderstanding?
Another question that i have is when a use a "browse product" (i.e. PHY: R=D2300, G=BD2210, B=BD1900), i check the spectral profile appearing like these (img_3) and i don't know how to put the values of the wavelenghts on the X axis to get a coherent profile.
If you could help me with these it will be really great.
Thank you,
-Wladimir
-
Hi dear community,
I'm starting with the CRISM data processing with ENVI 5.3 + IDL + CAT 7.4 but for now i feel a few lost, altough i keep the adventure. In any case, i have a couple of questions (very basics, probably) for the TRDR images from the CRISM map data center.
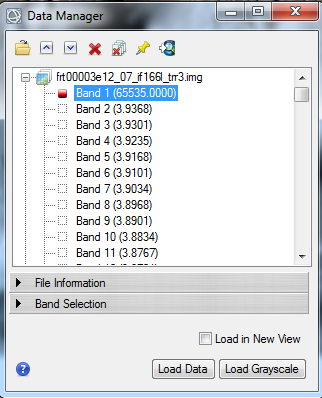
1.- Why when i open the trr3 images with CAT it appears as a rectangle (img_1) and not compressed or deformed like the images that i've seen in papers or documents? additionally it opens inverted so i have to apply a 180° rotation.
2.- When i open the images the band 1 has a value of 65535.0 (img_2)! and that carries problems when i want to visualize the spectral plot. So, it is recommended to eliminar this band or i'm doing something wrong with the images treatment?
Any kind of help will be very useful, since i'm really new on this.
Regards,
-Wladimir
Along-track stripping artifact correction and map projection
in For data users
Posted
I mean the black pixels which ENVI don't process for certain band selections custom stretched:
I want to "substract" only the painted shapes to put that over a CTX image, so the black part of this image would be the CTX image detailed surface or a DTM.
Thank you,
Wladimir