

Ray Arvidson
-
Posts
86 -
Joined
-
Last visited
Content Type
Profiles
Forums
Downloads
Blogs
Posts posted by Ray Arvidson
-
-
Yes, your results are what they should be, so congratulations.
Ray Arvidson
-
I suggest you look at the range of values in your cube. If there are extremely high excursions because of noise, or in L data, use of 65535 to indicate non-data, the system will scale its output relative to the extreme values and results will be black. Remove these values before proceeding.
Ray
-
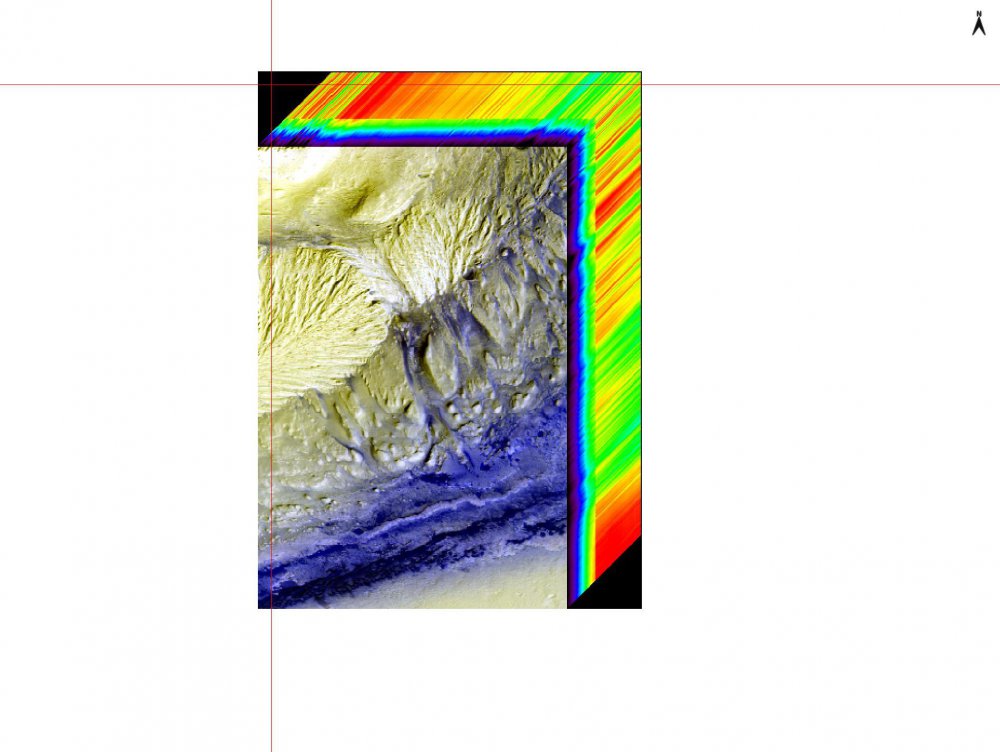
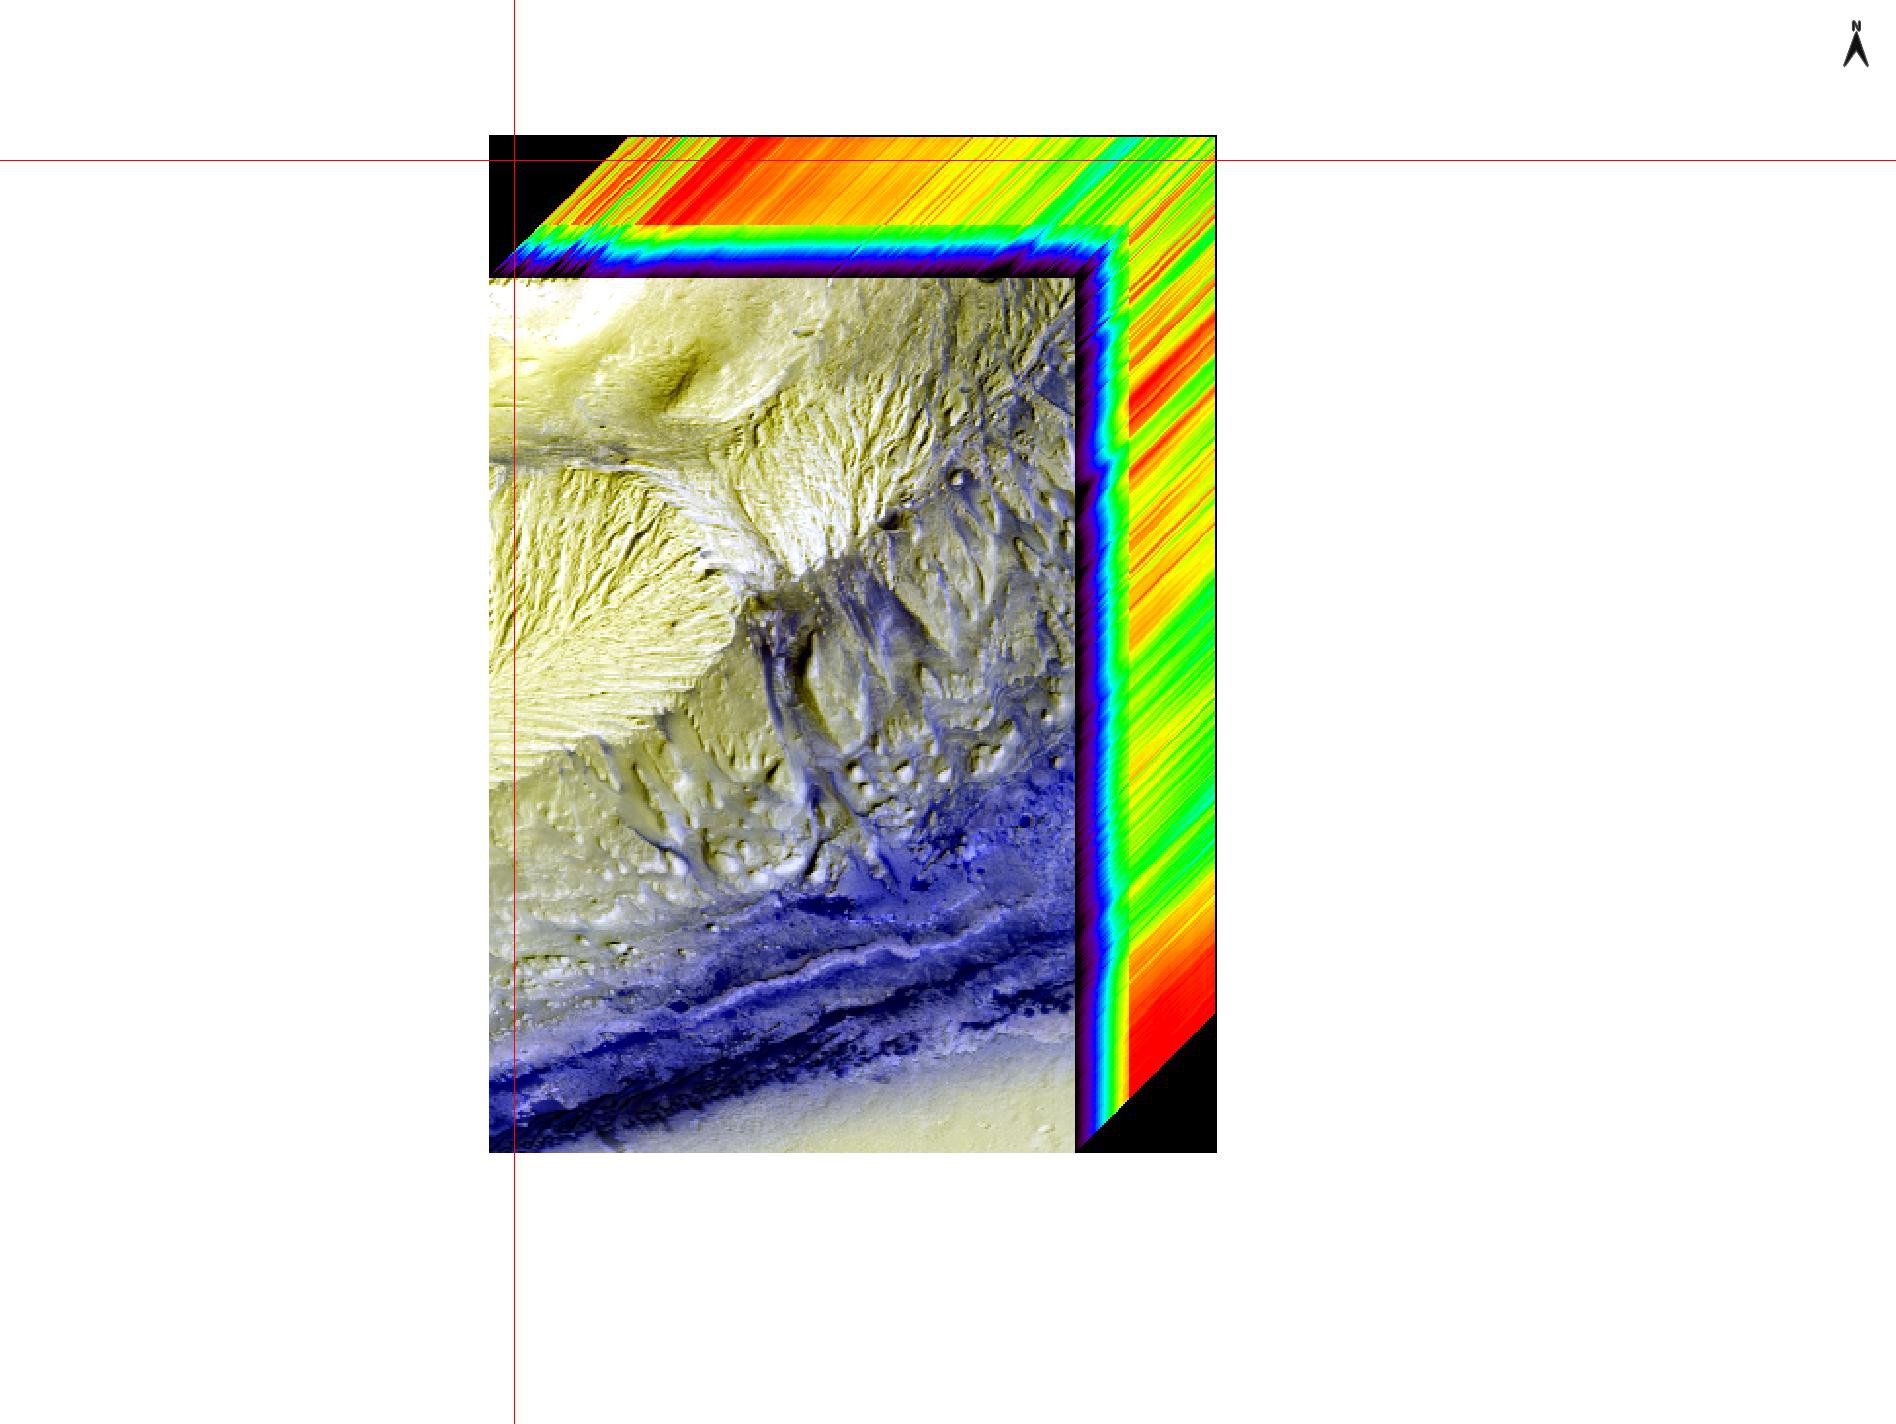
Hi: I am here to help. Tell me what you mean by a 3D cube? Do you want a data cube where planes are images and each pixel has a spectrum associated with it? So when you display the S and L combined cube and use the spectral plot as you move around the image in the display the spectrum for that location shows in a plot window. Is that what you want? Build 3D cube does not do that and only produces a nice perspective view of the cube with an image on the top and color-coded spectral values down the side. https://www.l3harrisgeospatial.com/docs/ImageCubes.html
Ray Arvidson
Ah, I see the problem with 3D data cube. It has to be a rectangular cube, square or rectangular. Not a map projected version, see attached.
-
Hi: I am the PDS Geosciences Node Manager and CRISM Team Member. The browse products are byte images and just meant for visual examination. The summary products generated are floating point images that are based on the algorithms shown in the CRISM Software Specification Document. I suggest you read about these products in that document, which is posted on our web site. https://pds-geosciences.wustl.edu/mro/mro-m-crism-2-edr-v1/mrocr_0001/document/crism_dpsis.pdf
Ray Arvidson
-
Hi there:
I will see if I can request from the code writers any documentation on the CIRRUS algorithm. I can tell you that there is no need to use any of the CIRRUS functions because the TRR3 I/F data cubes have been through a thorough denoising. I use CRISM data very day and have never used any of the CIRRUS functions. Also, the CRISM Team has generated, and we have posted on the Geosciences site, new versions of denoised cubes, TERs are in sensor space and MTRDRs are projected versions of the TERs. S and L cubes have been joined as one cube. See the CRISM SIS for an explanation of the processing: https://pds-geosciences.wustl.edu/mro/mro-m-crism-2-edr-v1/mrocr_0001/document/crism_dpsis.pdf
Ray Arvidson
PDS Geosciences Node Manager and CRISM Team Member
-
For the radiance data you must convert to IOF using the CAT tool before doing anything else. You need IOF products, i.e., radiance divided by the solar radiance for each band where the solar radiance used in the CAT conversion is for the heliocentric distance for Mars at the time of the observation.
Ray
-
First, do not give up on use of the IOF archive products. The artifacts mentioned in the Leask paper are associated with sharp albedo boundaries.
Second, you need to turn the radiance into IOF files in CAT by using the "Radiance to IoF" function. Then you can do volcano scans and other processing steps. This will just produce noisier results than using the archived IOF files.
I suggest do your work on archive and radiance to IoF files and compare results.
Ray Arvidson
-
Hi: I am a CRISM Team Member and PDS Geosciences Node Manager. So, you generated an IOF from radiance data. Then you did the "volcano scan" atmospheric correction, both using CAT? And you still have lots of noise in the 2 micrometer region, artifacts from trying to remove the CO2 triplet? Let me know and we can then go from there.
Ray Arvidson
-
Zhou Feng from my staff will be in contact with you to help with the CAT installation.
Ray
-
Hi: This is Ray Arvidson, PDS Geosciences Node Manager, and CRISM team member. The best way to open CRISM data with all wavelengths deployed to the header records is to use the CRISM Analysis Tool (CAT) that can be imported and used in ENVI. The code can be found at https://pds-geosciences.wustl.edu/missions/mro/crism.htm toward the bottom of the page. There is also a JAVA version that does not need ENVI. Let me know if you have any trouble implementing CAT. By the way with Mars temperatures there is no pure CRISM thermal regime, it is always solar-dominated, with some thermal contribution at the longest wavelengths.
Ray Arvidson
-
Hi Ralph: The min and max stretch values for parameter maps are scene dependent. Just make sure that you do not set the minimum to less than zero because then the negative values would correspond to bumps and not absorption dips. I typically set values for min and max based on comparing the stretched parameter maps to what can be seen in the false color CRISM images and whatever CTX and HiRISE data one can find. Mapping contiguous pixels in the parameter maps that overlay areas that look like geomorphic or geologic units gives me some certainty that I am mapping some mineral parameter that makes sense. Random detections across the scene just mean that you are mapping noise. Remember for your crater you should be looking for rim and crater ejecta deposits that are windows beneath the regolith, sand, and dust covers. Small areas but pixels should map close to one another.
Ray Arvidson
-
Hi Ralph: I hope our Zoom session and discussion of how to process and interpret CRISM data was useful. Unfortunately, I forgot to check the button saying record this session. Anyway, if you have any other questions let me know by email or via the Forum. Best of luck with your master's degree research. Remember to think about where in the crater you might expect some underlying bedrock to be exposed.
Ray
-
HI: Talor: I am a CRISM Science Team Member and also the manager our our PDS Geosciences Node. I will look later today at your note and respond. In the meantime I would highly recommend starting to use the ENVI 5.5.3 interface and not the Classic mode. Many more functions and CAT7.4 works well with it.
Ray Arvidson
-
Hi Ralph: Looks like you got pretty far along. Are you using CAT7.4 installed on ENVI 5.5.3? Also, typically, S data for CRISM do not contain as much mineral information as L data. I would use CAT 7.4 and the atmospheric correction in CAT to remove L data gas bands, then generate 2014 IR parameter maps and examine those for the presence of minerals like olivine, pyroxene, sulfates, and clays. Let me know if you downloaded and installed CAT7.4 from our web site.
Ray
-
Hi Ralph: I would be glad to help you through CRISM processing, both as a CRISM Team Member and PDS Geosciences Node Manager. First what version of ENVI/IDL are you using? I suggest not using Classic but rather the new 5 series interface. I use version 5.5.3. Once we are set with ENVI then I can tutor you through the steps using a Zoom session, which I will record so you can play it back as needed. Waiting to hear from you.
Ray Arvidson
-
You need to find an area in the corrected spectral data cube that looks spectrally neutral and divide your spectrum of interest by the spectrum that looks spectrally neutral. No DDR involved.
Ray
-
Hi There:
I am the manager of the PDS Geosciences Node and also a CRISM Science Team Member. The I/F data you are using come from the spectral radiance for each band and pixel location divided by the solar spectral irradiance divided by pi. The is a ratio of spectral radiances and the pi converts solar spectral irradiance to spectral radiance. The solar value used is specific for the heliocentric distance when the scene was acquired, i.e., Mars distance relative to he sun. Your I/F spectra, put through the volcano scan correction using CAT, look good. Here is what you are missing. The next step typically is to then divide the volcano scan corrected I/F spectra by a spectrum from the same corrected data for an area that looks like it is spectrally neutral. This removes any instrument artifacts and tends to de-emphasize the ubiquitous basaltic sands and regolith and thus emphasizes what might be unique in terms of mineral signatures for the area of interest. It kind is like in the lab when you use reflectance spectrometers you ratio your data relative to some standard surface. Remember there are no pure outcrops of given minerals on Mars, rather wind mixes things a lot. I hope this note helps. Please ask more questions if needed.
Ray Arvidson
-
Rachel: I am a CRISM Team Member and we have processed MSP data. The destriping is really for full resolution data, not so much for multispectral data. One of my graduate students, Thomas Condus, has been processing a lot of CRISM multispectral data. He can provide details as to how he has processed the data. His email is tcondus@wustl.edu. I will mention to him that you might be contacting him via email to ask for advice. It is currently about 7:30 AM CST and he typically comes in around 9 AM. He has helped several other students move through the sometimes complicated processing procedures and avoiding pitfalls in CRISM processing.
Ray Arvidson
-
Wladimir: I suggest you use ENVI 5.5.2 interface and upgrade to CAT 7.4. You can use the flatten function in CAT to suppress column dependent striping. And with ENVI 5.5.2 it is easy to co-register CRISM images with CTX or HiRISE images. Let me know if you have these versions of ENVI and CAT. The CAT 7.4 is available from our PDS web site. https://pds-geosciences.wustl.edu/missions/mro/crism.htm
Ray Arvidson
PDS Geosciences Node Manager
CRISM Team Member
-
Hi There:
I am going to try and talk you though use of our PDS Geosciences Node Orbital Data Explorer to get to Lunar Reconnaissance Orbiter DIVINER thermal data and maps that you can make for particular times and locations for brightness temperature of portions of the Moon of interest to you.
First go to our PDS Geosciences Node site: pds-geosciences.wustl.edu
Then go to Orbital Data Explorers, one of the choices on the upper left.
Next select Lunar Orbital Data Explorer.
Then select under additional tools Diviner RDR Query.
This will take you to a template to fill out that will search the DIVINER data for brightness temperatures for your time and location (e.g., UTC or local solar time, latitude range, longitude range) and ask you which channels to show. I selected channel 6 to show radiance for this band range. Try small boxes like maybe a 1/2 degree across to avoid long search times.
Now hit the query button to tell you how many observations are within your search area.
Then go to Request Results and include tabular data and a Grayscale (local range).
Next generate the products and when finished you will have a tiff image of brightness temperatures in Kelvins and a large spread sheet with the values used to make the image.
If this is all you need, fine. Need more and let me know so I can provide more help. Remember these are brightness temperatures and one needs emissivity to get the actual kinetic termperatures. But you should be pretty close.
Ray Arvidson
PDS Geosciences Node Manager
-
Hi there: Would you please let me know which MTRDR scene you have been examining and I will take a look at the data and spectral plots and then answer your questions.
Ray Arvidson
PDS Geosciences Node Manager and CRISM Science Team Member
-
Yes, I tend to use continuum removed spectra rather than ratioed spectra because the former does not introduce any biases introduced by ratioing to non-gray spectra. You might first subset your data to the wavelength interval containing the candidate absorptions and shoulders in order to highlight just the absorption features of interest.
Ray Arvidson
-
Greetings: I am the Director of the PDS Geosciences Node and also a CRISM Team Member. I believe that the top image you show is one called sensor space, i.e., how the instrument acquires data row after row. The bottom one is map projected. The DDR file has planes that include the latitude and longitude in sensor space, corresponding to the pixel locations of the actual data. Are you trying to project the data to map form? If so would you be trying to do this in Matlab? ENVI can be used with the CRISM Analysis Tool (CAT) to do this for you. But if you need to use Matlab let me know in more detail what you are trying to do and we can help you get there.
Ray Arvidson
-
Oh and to remove artifacts in the spectra many scientists ratio the data to a "bland" spectrum from the same column in the data. You just need to make sure that the spectrum you ratio to does not have spectral features that would make some artifacts in the ratioed data. I personally do not do the ratios for this very reason.
Ray Arvidson
CRISM Band Math
in For data users
Posted
Yes, for each pixel in the scene R2210 means use the reflectance value at 2210 nm. ENVI's Band Math function will allow you to write an equation that when run produces the parameter map.The tool is in the ENVI5 series interfaces on the right hand side under Band Algebra. Also, the weightings a, b, etc. in the equations allow centering of the computation over the deepest part of the putative absorption feature, all relative to the wavelengths on the continuum on either side of the feature.
Ray Arvidson