Search the Community
Showing results for tags 'reflectances'.
-
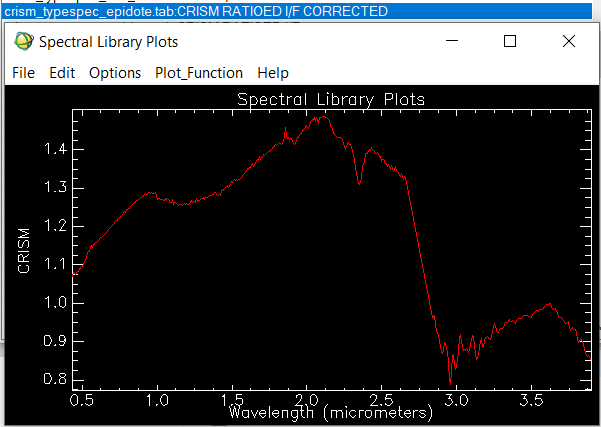
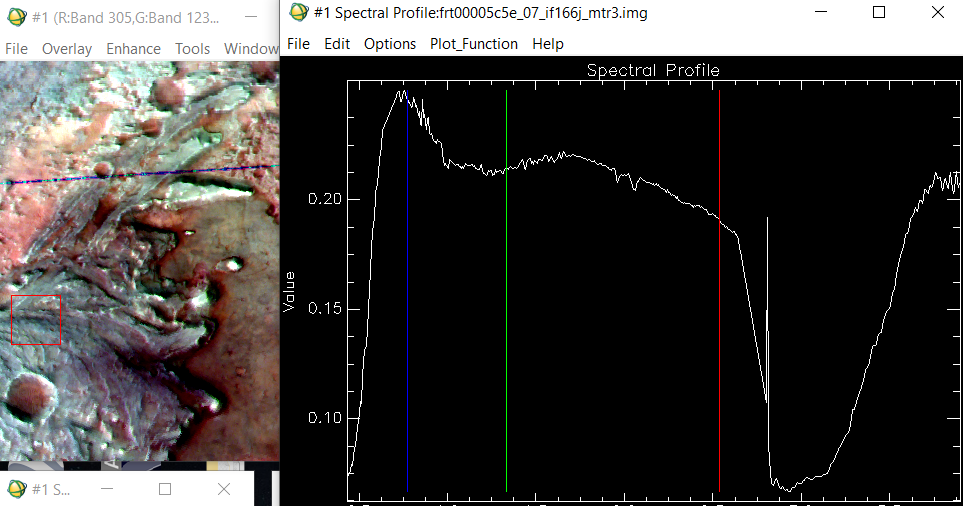
Good afternoon. I'm an undergraduate student of geomatics and remote sensing, and I was trying to use the CRISM images to classify minerals and chemical compounds on the surface of Mars. I collected some information about all the products to use, also I followed the workflow proposed here and I installed CAT on ENVI. I was trying to use a an image of the Jezero Crater data product: frt00005c5e_07_if166j_mtr3, which is projected, atmosferically and geometrically corrected. The data is on I/F which as is explained here, on the FAQs means: Q: What does I/F stand for? A: CRISM is a reflectance spectrometer, and I/F is how reflectance is represented algebraically: I is the energy (actually radiance) observed by the CRISM instrument, and F is the energy (actually solar irradiance) incident at the top of the Martian atmosphere. I/F is a ratio of energies (radiance/irradiance), with some additional scaling so the ratio is unitless. Acording to my knowledge radiance/irradiance=reflectance (unitless), maybe I'm wrong. The case is that I tried to classify the minerals on the image of the Jezero Crater using this library from Viviano et al using the "CRISM RATIOED I/F CORRECTED" spectra but I get wrong or absurd results. I noticed that the spectra of my images is clearly different from the spectra that I find on the Viviano library ratioed i/f. My Spectra always follow this pattern, and never reaches a reflectance of 0.5. Nevertheless on the Viviano library I found spectra like this one of epidote: Why the spectra of my image is so different? Is my data really on reflectance? How can I get real reflectances?
- 14 replies
-
- envi
- spectral library
-
(and 2 more)
Tagged with:

