

Ausiàs R
-
Posts
4 -
Joined
-
Last visited
Content Type
Profiles
Forums
Downloads
Blogs
Posts posted by Ausiàs R
-
-
I'm sorry,
I don't know what that area can be or how can I get it. Nevertheless thanks for your help.
Ausiàs.
-
Hi Ray,
First of all I want to thank for your reply, it is really apreciated.
You said that:
On 3/3/2020 at 4:37 PM, Ray Arvidson said:The next step typically is to then divide the volcano scan corrected I/F spectra by a spectrum from the same corrected data for an area that looks like it is spectrally neutral.
I understand that the area that looks like it and is spectrally neutral means an area that exhibes a constant reflectivity or transmissivity over the electromagnetic spectrum. But, where can I find this kind of surface/area?
Is the data that I need on the ddr files of the image? I saw that there are 14 bands on the ddr images. On this document (pages 76-77) it is explained what those bands represents. I'm not pretty sure which band I shoud use, or if any.
Once again, thanks for your answer,
Ausiàs.
-
Good afternoon.
I'm an undergraduate student of geomatics and remote sensing, and I was trying to use the CRISM images to classify minerals and chemical compounds on the surface of Mars.
I collected some information about all the products to use, also I followed the workflow proposed here and I installed CAT on ENVI. I was trying to use a an image of the Jezero Crater data product: frt00005c5e_07_if166j_mtr3, which is projected, atmosferically and geometrically corrected. The data is on I/F which as is explained here, on the FAQs means:
Q: What does I/F stand for?
A: CRISM is a reflectance spectrometer, and I/F is how reflectance is represented algebraically: I is the energy (actually radiance) observed by the CRISM instrument, and F is the energy (actually solar irradiance) incident at the top of the Martian atmosphere. I/F is a ratio of energies (radiance/irradiance), with some additional scaling so the ratio is unitless.
Acording to my knowledge radiance/irradiance=reflectance (unitless), maybe I'm wrong.
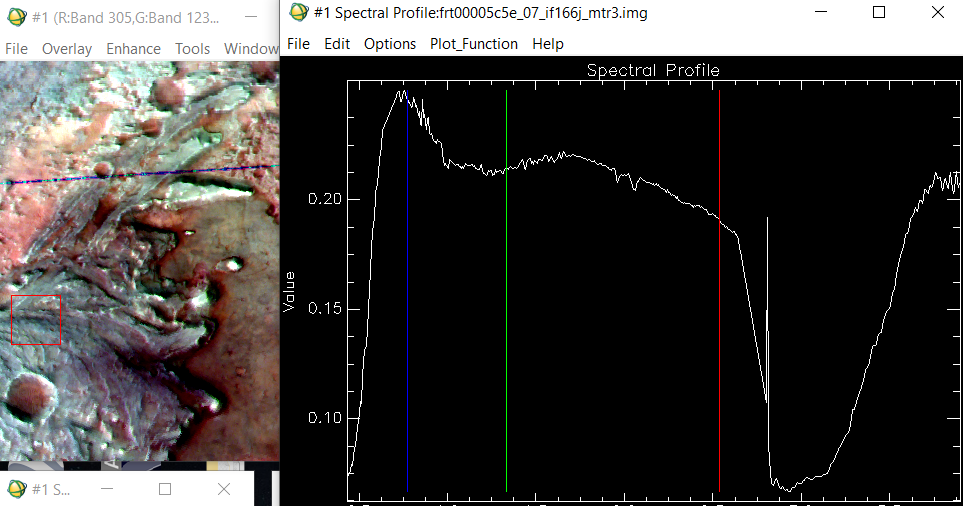
The case is that I tried to classify the minerals on the image of the Jezero Crater using this library from Viviano et al using the "CRISM RATIOED I/F CORRECTED" spectra but I get wrong or absurd results.
I noticed that the spectra of my images is clearly different from the spectra that I find on the Viviano library ratioed i/f. My Spectra always follow this pattern, and never reaches a reflectance of 0.5.
Nevertheless on the Viviano library I found spectra like this one of epidote:
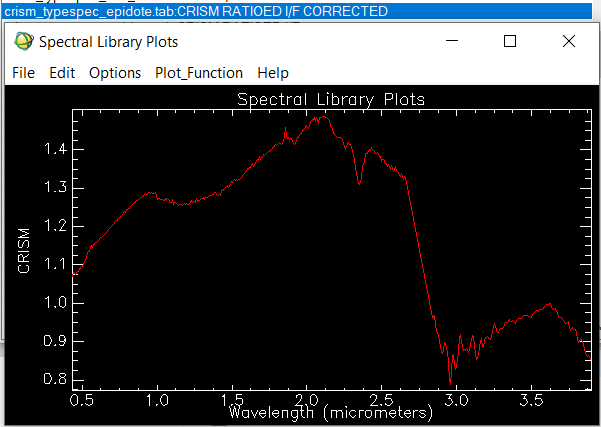
Why the spectra of my image is so different? Is my data really on reflectance? How can I get real reflectances?
About the data type of the CRISM I/F images
in Using the Spectral Library
Posted
Hi,
Take a look to these pdfs (more precisely to the last one):
https://pds-geosciences.wustl.edu/workshops/CRISM_Workshop_Mar09.htm
Ausiàs.