Search the Community
Showing results for tags 'crism '.
Found 4 results
-
 September 14th, 2017 Release 7 of MRO CRISM MTRDR (Map-projected Targeted Reduced Data Record), TER (Targeted Empirical Record), and TRDR (Targeted Reduced Data Record) browse and extras data fills in data from 2006_273 through 2012_142 has been loaded into ODE. See https://wufs.wustl.edu/ode/odeholdings/Mars_holdings.html
 -
 This is the seventh release of CRISM MTRDR and TER data products. In addition, the volumes MROCR_2101 through MROCR_2106 are updated with new TRDR browse and extras data products.
 -
September 3rd, 2017 - MRO Release 42 Loaded into ODE. - Updated MRO CRISM EDR and CDR products from September 27th, 2006 to May 9th, 2017 - Updated MRO CRISM DDR products from September 27th, 2006 to May 8th, 2017 - Updated MRO CRISM LDR products from July 10th, 2009 to April 29th, 2017 - Updated MRO CRISM TRDR products from September 27th, 2006 to May 8th, 2017 - Updated MRO raw gravity data products released through October 21st, 2017 - Updated SHARAD Radargram data products released through 2017-02-16 (orbits 48202 through 49499). - Updated MRO MCS EDR, RDR and DDR products from September 15th, 2006 to April 30th, 2017 - Updated MRO CTX EDR products from August 30th, 2006 to March 1st, 2017 "There is no derived gravity data in this release. Previous releases of HiRISE data cover this period, and HiRISE's next three months of data are not all available yet." Please see ODE Mars Holdings – https://wufs.wustl.edu/ode/odeholdings/Mars_holdings.html
-
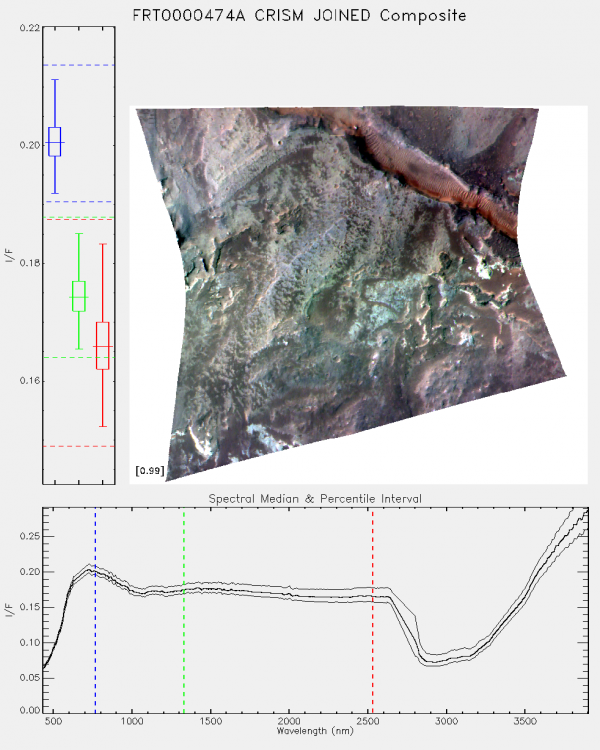
User Bobo Xi August 30, 2017 9:06 AM Dear Prof. I'm a postgraduate in xidian university,china. I'm research in the hyperspectral imge of mars at present and have downloaded the CRISM data on the PDS Geosciences Node. The datatype of the data is MTRDR and ID is “frt0000474a_07_if164j_mtr3”. Then,I have two problems with it : 1.First, I have read the "CRISM Data Product Specification", it said that the TER datas is "A spatially reconciled, full spectral range I/F targeted observation central scan image cube in the IR (L-detector) sensor space that has been corrected for geometric, photometric, atmospheric, and instrumental effects." and "MTRDRs are map-projected versions of TER data products." Then,I want to confim that does that mean that the MTRDR datas have calibrated for geometric, photometric, atmospheric, instrumental effects and map-projected ? 2. Second,the attachment of this email is the Browse Image of the MTRDR data I have dowmloaded . My question is that what is the meaning of the curve below ?In addition, I have open the MTRDR data by envi5.1 and why the spectral curve almost stay the same for each pixel in the image ? I'm feeling very confused and looking forward to your reply! Best regards! User Seelos, Frank P. August 30, 2017 1:38 PM > I want to confim that does that mean that the MTRDR datas have calibrated for geometric, photometric, atmospheric, instrumental effects and map-projected? This is correct. The only structural difference between the sensor space TER spectral image cube (the IF product) and the corresponding map-projected MTR spectral image cube is that radiometrically questionable bands have been removed from the MTR. The TER image cube has 545 bands and the MTR has 489. > Browse Image of the MTRDR ... My question is that what is the meaning of the curve below The plot shows the scene median and [5, 95] percentile envelope spectra. > the spectral curve almost stay the same for each pixel in the image The spectral variability in this scene is subdued by a relatively dusty atmosphere. The TER/MTRDR processing accounts for atmospheric gas absorptions and the relative geometric/photometric effects of aerosol scattering, but the data are top-of-atmosphere corrected I/F, not model ground reflectance. User Bobo Xi August 30, 2017 11:14 PM Hello, Thanks for your reply. but exuse me, I'm still not clearly understand my last question. In other words,if I want to make mineral classification in the image by using the material's spectral variability, does that mean that I have to use the TRDR datas and calibrate them myself by using some ground reflectance model rather than directly using the MTRDRs? User Seelos, Frank P 2017-09-01 03:40:48 If you’re interested in quantitative mineral abundance modeling then the retrieval of surface spectral reflectance through some type of surface/atmosphere separation or atmospheric correction will be required – either the TRDRs or the TERs/MTRDRs could be the starting point in this case. However, mineral identification, classification, and investigation of scene spectral variability are definitely possible with corrected I/F data – the majority of the CRISM-derived results in the literature used this type of workflow. Thanks, -Frank User Bobo Xi September 03, 2017 9:13 PM Sorry, I have been busy with something else and forgotten to write back. After seeing your reply I have totally understood, thank you very much!