Deepali
-
Posts
10 -
Joined
-
Last visited
Content Type
Profiles
Forums
Downloads
Blogs
Everything posted by Deepali
-
Hi All, I am trying to calculate the time required for a channel on Mars to deposition certain amount of chloride in an area. I know the volume (and the mass) of chloride deposit in my study area. I have calculated discharge rate of the channel using Manning's as well as Darcy Weisbach's equation. I have used CTX DEM for measurements. Can anyone tell me how to proceed further? Thanks Deepali
-
Thanks Ray. I only had doubts of them being artifact and not real absorptions. I'll find out explanation for them like you suggested. Deepali
-
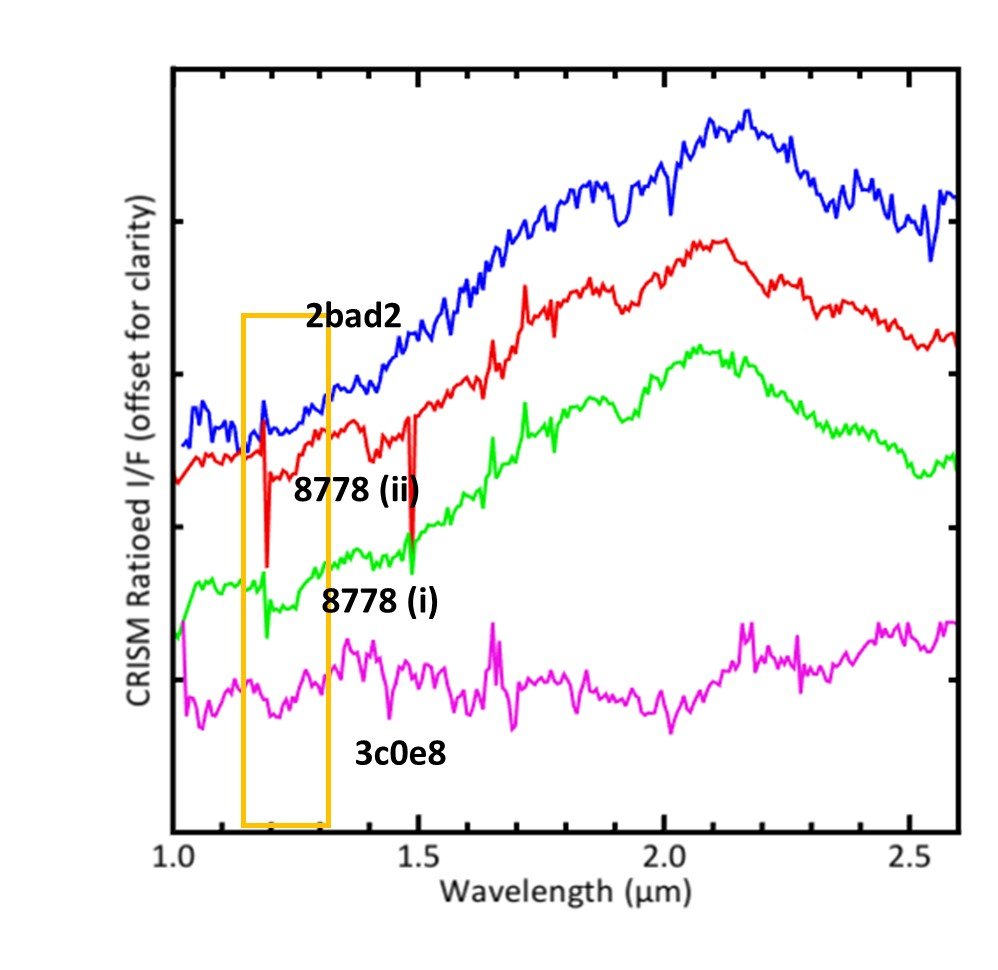
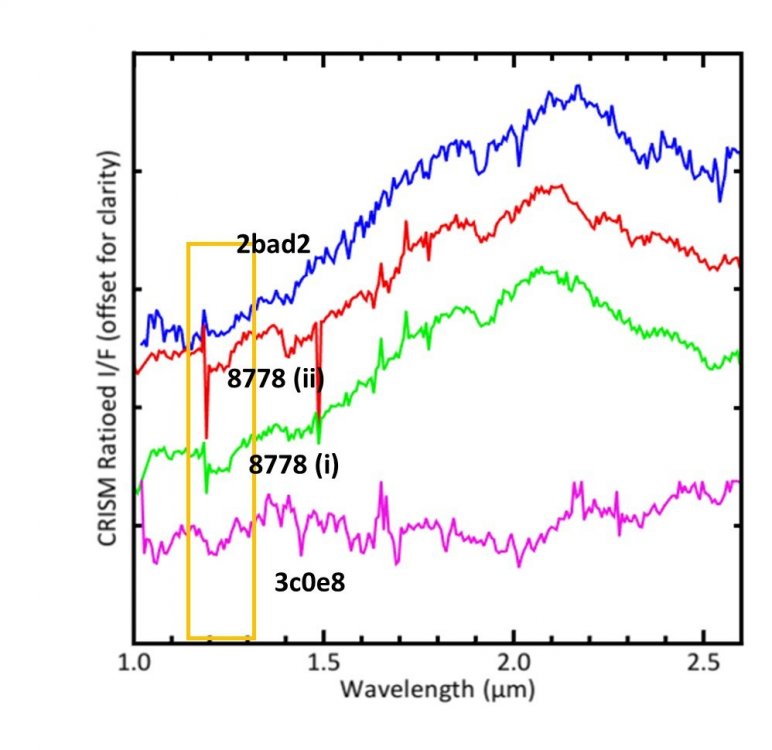
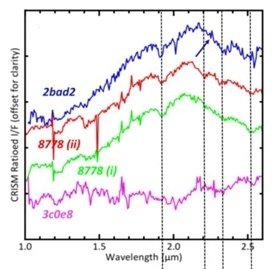
Dear Ray, Please find the plot showing spectra in which I observed features around 1.2 micron. The wavelength region in question has been highlighted with a yellow box. The CRISM IDs are mentioned next to their respective spectrum. Full IDs were shared in one of the previous comments. Thank you. Deepali
-
Dear Ray, I studied the 8778 spectra (Attachment 2) again and the locations from which both these spectra were recorded did not have any sharp boundaries. I also noted (please see 1.2-1.3 micron range) that despite being taken from different locations both the 8778 spectra have absorption at 1.2 micron. The feature has shoulders at 1.18 and 1.27 micron it appears as a curve rather than a spike. In fact this is true for all spectra in fig. 2 although I didn't reexamine all of them. I'll do that again and probably look at radiance data. Various explanations for decrease in band depth are also available through experimental studies. Therefore, I am in doubt that if artifacts display curved absorptions? I'll be grateful if you could give your insight in this. Thank you. Deepali
-
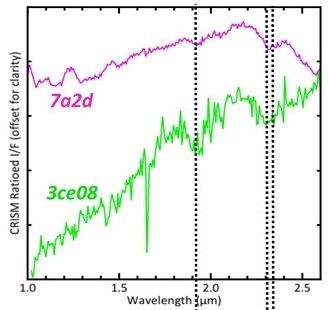
Dear Ray, The absorption at 1.2 are curved and do not appear as spikes. I apologise if I am wrong in assuming so, I am new to this field. The second picture represents putative carbonate signatures. I studied that hydrous carbonates also have absorption bands at this wavelength. You obviously know better than me but I am not sure therefore I want to confirm. Thank you. Deepali
-
Thanks Ray. Here are two images of the spectra in which I observed the feature. The image IDs are FRT00008778, FRT0002BAD2, FRS0003C0E8, FRT00007A2D. Deepali
-
Hello, I am a PhD scholar exploring water associated morphology and mineralogy of the Martian surface. While analysing CRISM dataset for secondary minerals in my study area, I have observed a narrow band near 1.2 micron. This feature was observed in at least 3 datasets. I carried out literature survey for clarification regarding this feature. Some studies have attributed this an artifact while others propose it to be a result of (i) fe substitution in plagioclase feldspar (ii) fe-rich/coarse grained olivine (iii) weathering of impact glasses etc. (based on band centre and depth). Can anyone give pointers regarding its classification. Thank you.
-
Need help for sulfate detection using CRISM data
Deepali replied to Deepali's topic in For data users
Hi Ray, I have used IOF products for my work but for sulfates I have been told to confirm the absorption features by looking into radiance data also (in which I am facing this problem). Anyhow, so even for radiance data we have to do IOF conversion before analysis? Thanks. -
Need help for sulfate detection using CRISM data
Deepali replied to Deepali's topic in For data users
Hi Ray, Thank you so much for replying. Hope you are doing fine. For the other minerals I processed CRISM images in CAT following the steps advised in workshop ppts (ATP corrections, georeferencing, summar parameter calculation). For sulfates, as you must be aware, an issue regarding artifacts at 2.1micron has been raised. So I used radiance data for them specifically. And no correction was done on them. But in the end, I ratioed the radiance data (for representation purpose basically) but still I got triple absorption of CO2. That problem was observed in 1-2 datasets only. The feature was nullified in other CRISM images upon ratioing. Since it has been suggested that a step during atmospheric correction may be responsible for thus artifact, I did not carry out volcano scan correction in radiance data. Are you suggesting I should perhaps try that? Beacuse of the spikes at that wavelength, it has become very difficult for me to correctly identify if the absorptions are real or not. I am willing to share the images of ratioed radiance if that is helpful. Thank you again for your time. -
Hello, I am a PhD scholar exploring water associated morphology and mineralogy of the Martian surface. I am working with L band of CRISM for detection of sulfates in my area. As Leask et al. (2018) have brought forward concerns with possible artifacts at 1.9 and 2.1 micron, I am having difficulty with confirming sulfates in my area. I have analysed radiance data for the same (as suggested by them). But my study area is dust covered so it has a lot of noise and spikes. I have tried ratioing radiance data but CO2 bands still persist. It does show absorption at those wavelength (similar to ratioed I/F) but CO2 absorption at 2.0 micron are big enough to destroy whole band shape. As of now, I am not sure if they are actual or spurious absorptions. It will be grateful if anyone can help me in confirming the results or suggest any method for resolving this issue. Thank you.