Rochdi
-
Posts
39 -
Joined
-
Last visited
Content Type
Profiles
Forums
Downloads
Blogs
Everything posted by Rochdi
-
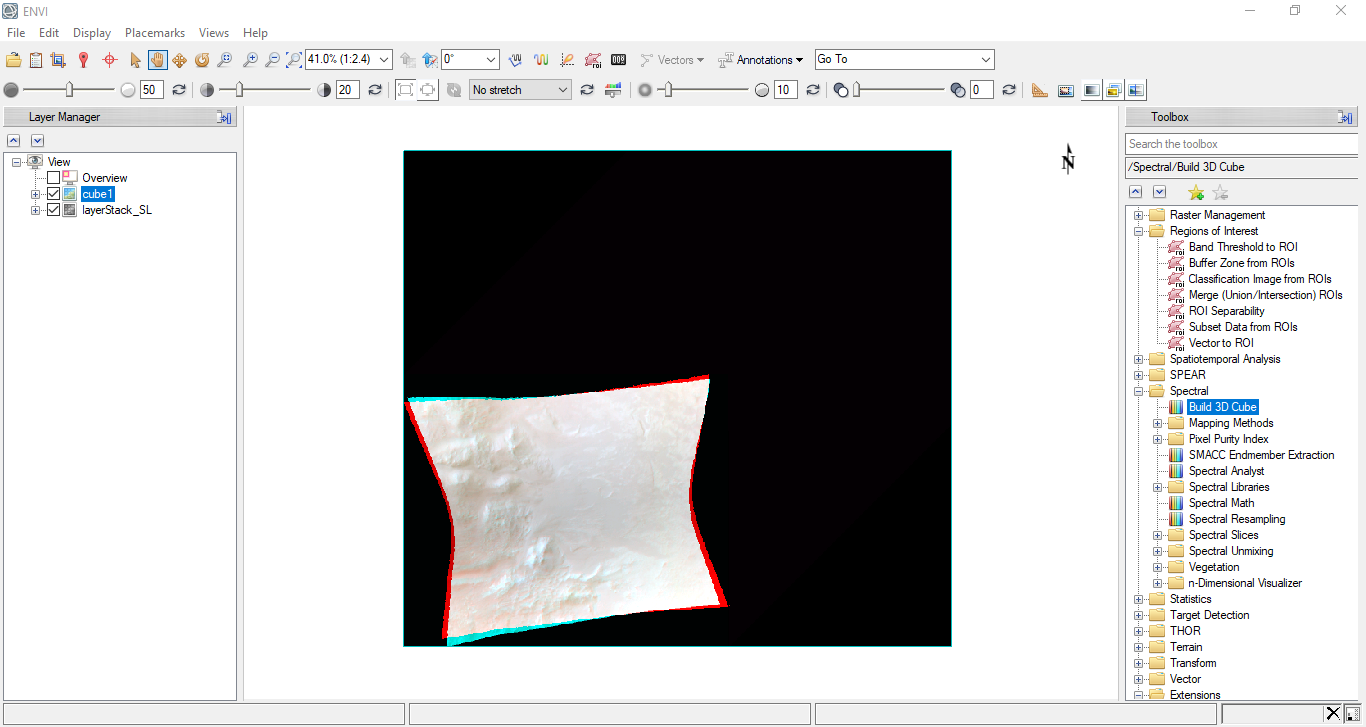
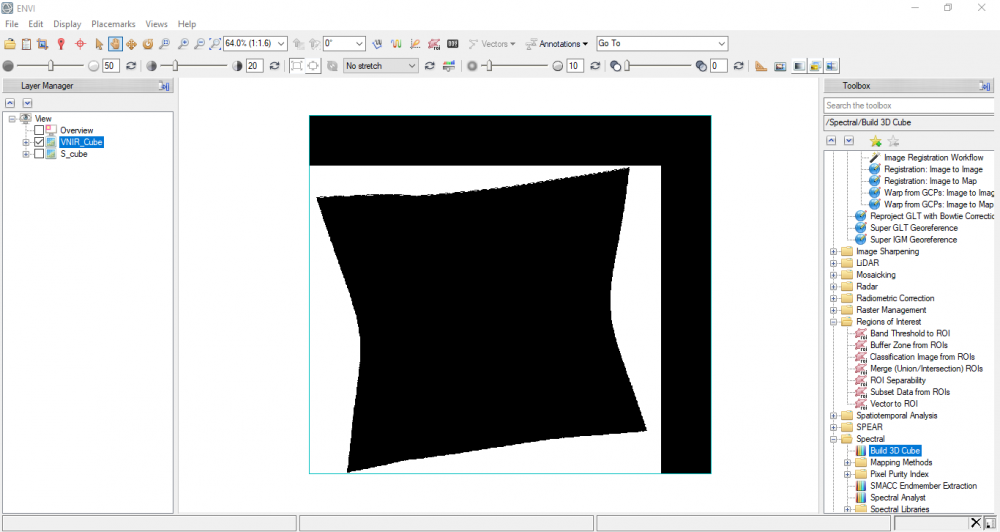
Hello Sir Ray, I did a quick stats for the VNIR range (S cube) to check which bands contain the mentioned value, and I found the first five bands of this range with 65535 value. Then, I exclude these none-data using ROI and subset to come up with a sub image without 65535 value before building the 3D cube. Here's the outputs I came up with as I attached below (then, I edit the header file of the output by adding data ignore value = 0 in order to remove the black area that surround the cube). Would you please let me know whether the output is accurate or not? Rochdi.
-
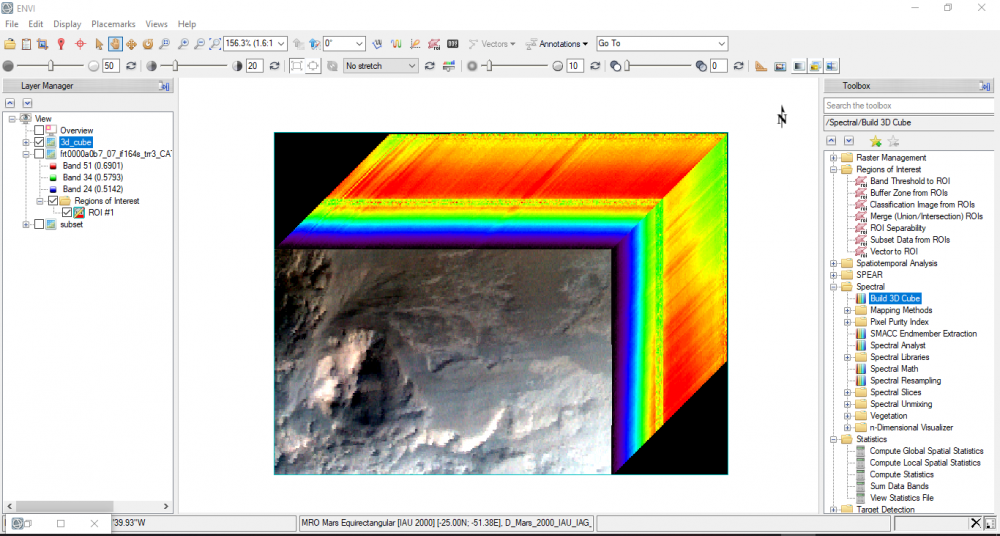
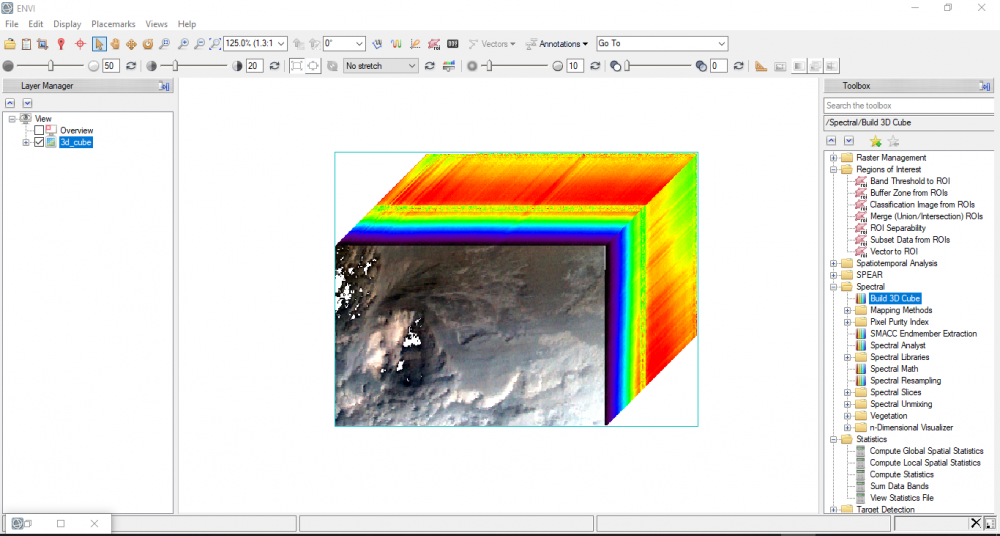
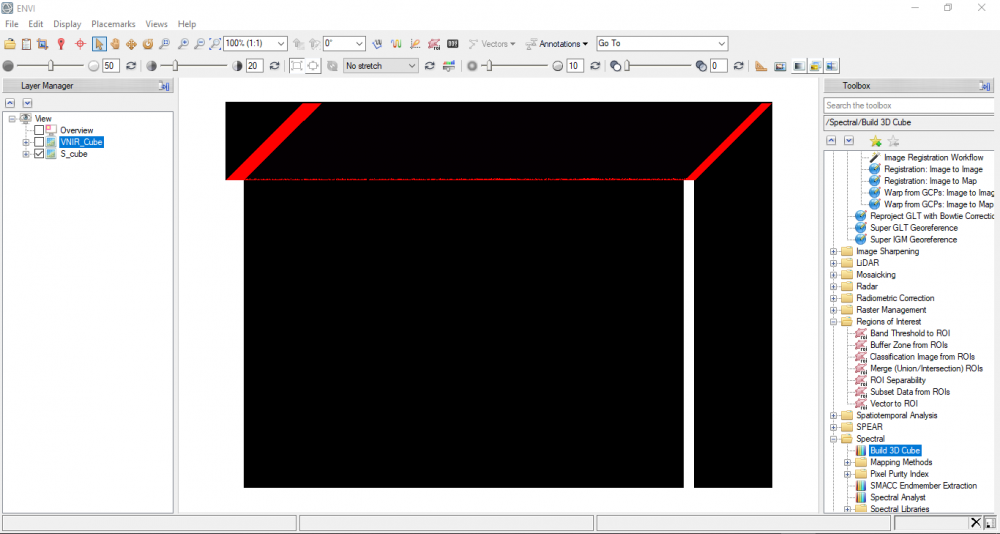
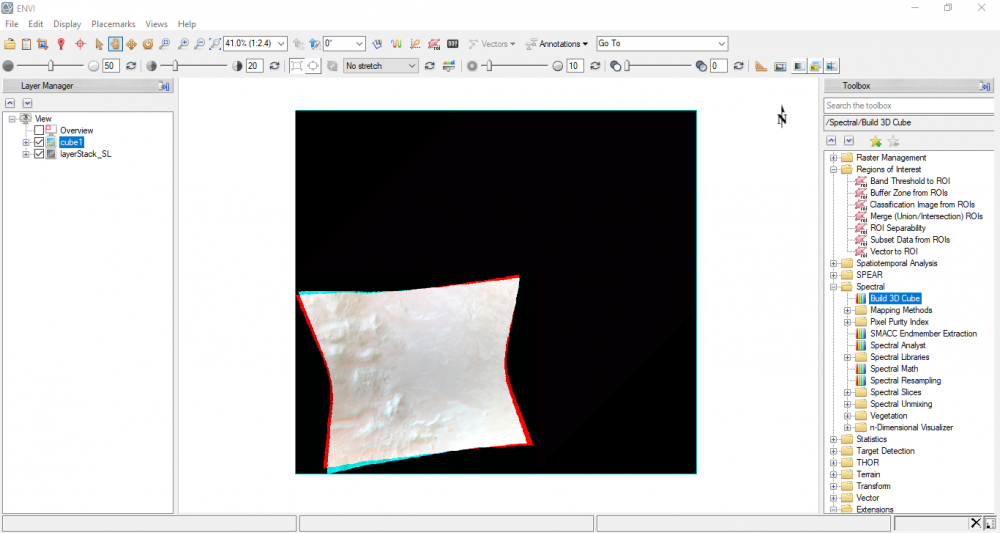
Hi Sir, Thanks a lot for your help, What I meant by building a 3D cube is exactly what you attached above, a 3D view of the cube with an image on the top and color-coded spectral values as well on the side. Depending on my system capability, it seems fine to build a 3D cube only for the VNIR range. Is it possible to build a 3D cube only for VNIR range relying on the instructions you mentioned in the link above? I followed the instructions in your mentioned link to come up with a 3D cube for VNIR range. I selected the input file and I performed a spectral subsetting of 107 bands. Then, I chose the bands I want to place on the face of the image cube (R: Band 51 | G: 34 | B: 24) and a Rainbow as color side. To apply a multiplier to the pixel dimensions of the side and top, I kept the border and spectral scale values as default. However, I come up with these unexpected output results as I attached below. Look forward to your reply, Rochdi.
-
Hello Experts, After I merged S and L cubes into a single layer, I would like to represent these spectrums (Visible, NIR and SWIR) into a three dimensional cube. I used a "3D cube" tool in ENVI toolbox to do this, then I chose 3 bands from each mentioned spectrum to make a color composite.However, I didn't get the expected result as seen below. Is something wrong? I look forward to your reply. Rochdi.
-
Hello Feng, Thank you very much, I'll dive into it.
-
Hello, Expert. I have downloaded CRISM TRDR dataset concerning Ritchey crater. Then, I've implemented CAT extension in order to do some photometric and atmospheric corrections as well. As known, the TRDR dataset broken out into two ranges: VNIR (0.3646 - 1.0560) and includes 107 bands. IR (1.0014 - 4) and includes 438 bands. I want to split up those ranges to Visible, Near-infrared and Short-wave infrared into these following wevelength: Visible (400nm to 700nm) Near Infrared (700nm to 1300nm) Short-wave infrared (1300nm to 3000nm) It means if I split up CRISM VNIR range into visible and NIR spectrums, the visible spectrum starts from band7 to band53 (band7: 0.4036 - band53: 0.7032) and the rest of VNIR bands will be considered as NIR spectrum. However, the NIR spectrum extends till 1300nm and VNIR's last band wavelength is 1.0560, meaning that NIR needs some additional bands to be completed. My question: Can I take some bands from CRISM Infrared range to come up with a complete NIR spectrum? Look forward to your reply, Rochdi.
-
Thanks a lot, Mr Feng. I really appreciate your help.
-
Hi Feng, Really? Have you watched the winRar recordings folder? Is everything okay, I could start using CAT now? (Even an error has occurred once I used your other recommended way). Look forward to your reply.
-
Hi Feng, This is Rochdi, Hope you're doing well I'm getting stuck on CAT implementation on ENVI, and I have no clue of what holding me back from installing this extension on ENVI. Is there any way to read PDS images on ENVI, or ERDAS (Any GIS software) without using this extension. Any recommendation? Look forward to your reply.
-
Feng, I agree (It's five hour difference). I'm using ENVI 5.3 on Windows, and the idl.pref file includes comments (# ... #), I tried before to add the IDL path to this file below the comments.
-
Hello Feng, Thanks a lot for paying attention, and I really appreciate your help. I'm from Morocco, and I need to get aware of your timezone in order to know when would it be convenient for us to meet for solving CAT issue. Please, Could we contact on Google meet? Look forward to your reply, Feng
-
Thanks a lot, Sir. I will be waiting for him.
-
Hello, I'm getting trouble to implement CAT, ENVI toolbox displays the extension, but when I clicked on it's not working either. I tried to restart ENVI and rebooting the system as well and the extension is not working yet. Any help? Look forward to your reply.
-
Is it possible to open PDS data using Erdas or ENVI? What it takes?
Rochdi replied to Rochdi's topic in For data users
Thanks for paying attention, Sir. I used JCAT before, but I didn't find a way to seperate bands, the only thing I could do with this tool is to do some bands operation, atmospherc corrections, and adjust RGB values and saving spectral data as well. Conversely, I installed CAT extension using cat setup doc and it's listed on ENVI toolbox but once I clicked on, the window extension not displayed. Do I missed something, Sir? Look forward to your reply -
Hello, Experts I've downloaded CRISM data from Orbital Data Explorer to do some analysis on Ritchey Crater, As known, the appropriate directory is TRDR and I chose FRT images depending on the study's goal. Here's an example of a sample I dowloaded: VNIR range: frt0000a0b7_07_if164s_trr3.img frt0000a0b7_07_if164s_trr3.lbl frt0000a0b7_07_de164s_ddr1.lbl frt0000a0b7_07_de164s_ddr1.img IR range: frt0000a0b7_07_if164l_trr3.img frt0000a0b7_07_if164l_trr3.lbl frt0000a0b7_07_de164l_ddr1.lbl frt0000a0b7_07_de164l_ddr1.img The purpose is to seperate these ranges to these following bands (Visible, Near infrared, short wavelength infrared, and thermal as well) using ENVI or ERDAS. However, when I import data I got an error said: "this raster file has no layers" or unsupported format if I use these programs. I need to know what hold me back to read these images. Is there something wrong with these dataset? Do I missed something else? I look forward to your reply.