Hello,
I am a graduate student working on mineral analysis using CAT v.7.4 and ENVI Classic v.5.5 + IDL 8.7 (64-bit). I have downloaded and unzipped the following data:
FRT0000A7FE_07_IF166J_MTR3
FRT0000967E_07_IF166J_MTR3
FRT0000A2CD_07_IF166J_MTR3
FRT00005C7D_07_IF166J_MTR3
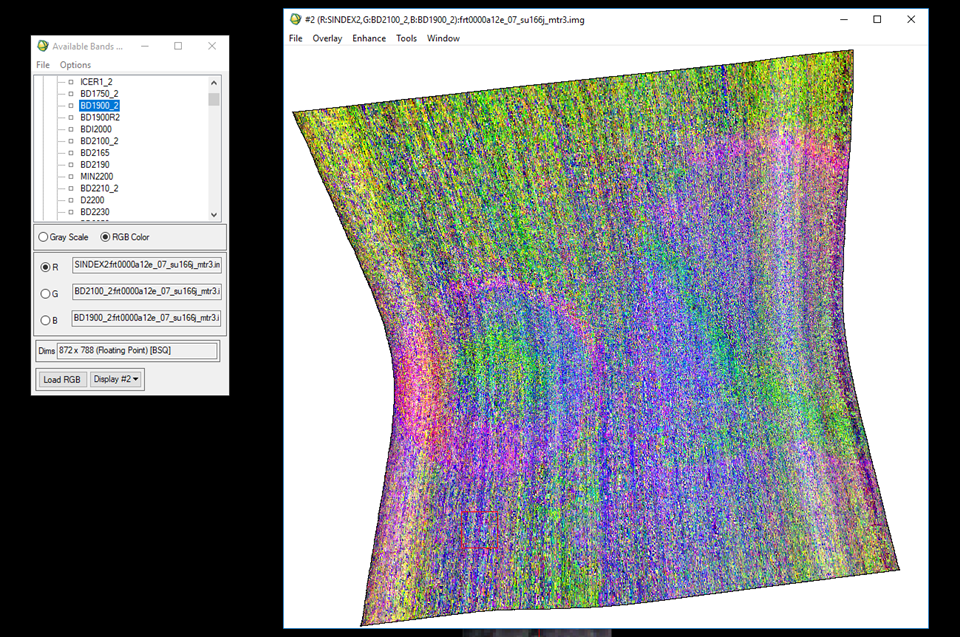
FRT0000A12E_07_IF166J_MTR3
FRT0000400C_07_IF166J_MTR3
FRT0000859F_07_IF166J_MTR3
FRT000096DF_07_IF166J_MTR3
FRT00007DB7_07_IF166J_MTR3
FRT0000A1B5_07_IF166J_MTR3
FRT00008F27_07_IF166J_MTR3
FRT0000A16F_07_IF166J_MTR3
I am trying to follow the processing steps provided in the CRISM 2012 Data Users’ Workshop MTRDR Data Analysis Walk-Through PDF. For your convenience I have attached the PDF to this post. I am currently having issues with loading the D2300 Single Band summary parameter cube. In the PDF, the image is very distinct and is very clearly a similar image to the original expect in gray-scale. Comparatively, when I load the D2300 image for any of the above data, I get very noisy images with little to no similarity to the original. For example,
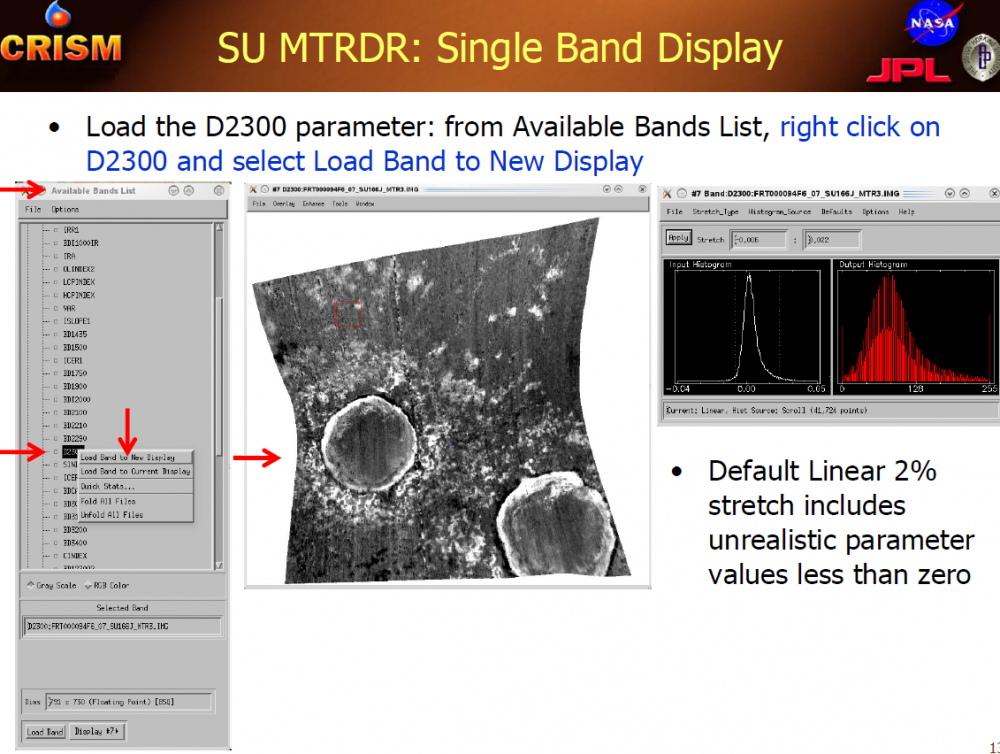
The PDF version of a D2300 Summary Parameter Cube:
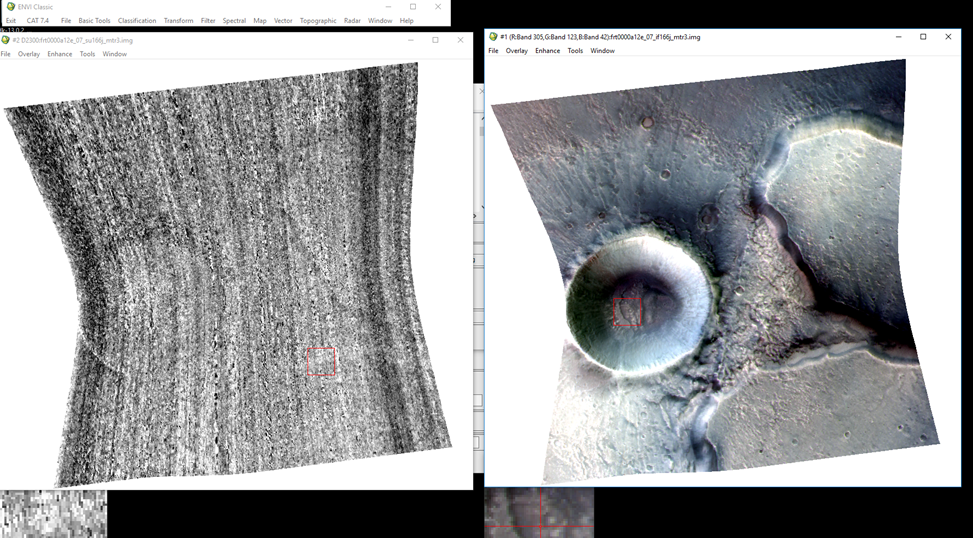
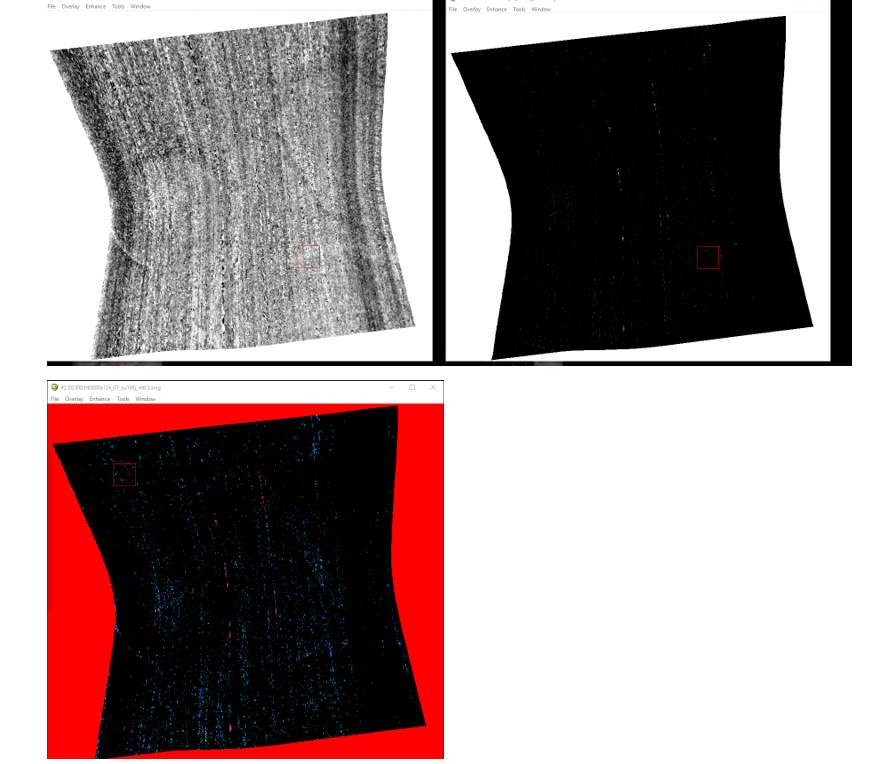
My version of the FRT0000A12E_07_IF166J_MTR3.img when loaded in grey-scale with the D2300 parameter:
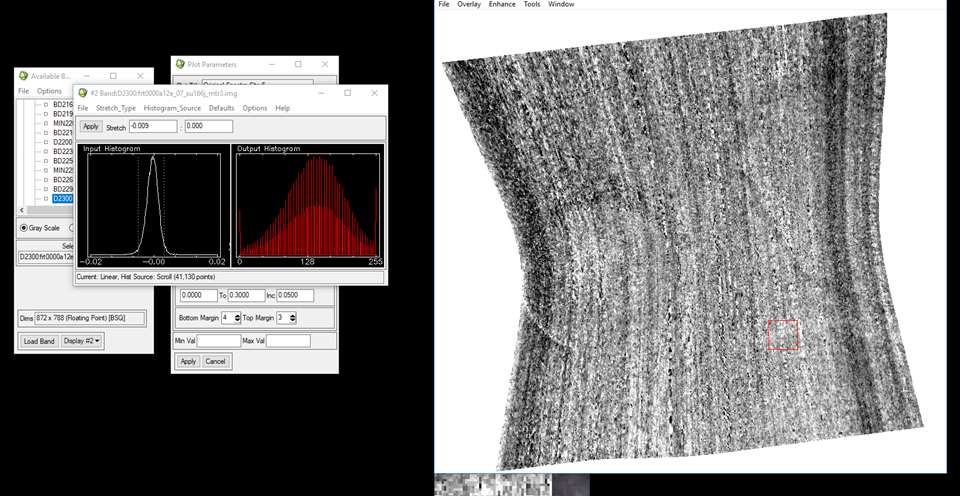
In the PDF, it is instructed to customize the stretch to 0 for a minimum and 0.02 for a maximum. When I apply this stretch to my image, again I have a very different image than the example:
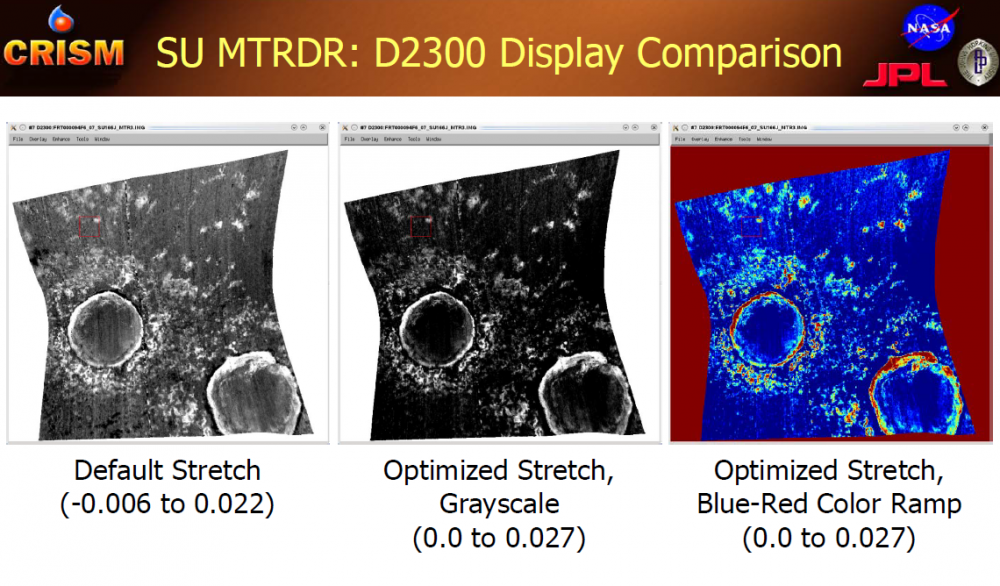
PDF Example:
My version of the above Default Stretch, Optimized Stretch Gray-scale, and Optimized Stretch Blue-Red Color Ramp. I have adjusted the histogram in my data to the same values as the PDF.
My first question is, even though the data differ completely, should the integrity of the image not stay similar throughout processing? Do the images located in my study region have too much noise? Should I preform a volcano scan, de-striping, and atmospheric correction to a MTRDR image? I am unfamiliar with the software and do not want to make any interpretations about the data until I am comfortable that the process I am using is accurate and correct.
My second question stems from the first. In my study region I would like to analyze the data for any detection of hydrated minerals in the region. When running a hydration analysis I found a few band math options to try (R:SINDEX_2/ G:BD2100_2/ B:BD1900_2) or (R:BD2100/ G:D2400 /B:D1900). When I plug these bands into the available bands list, the result is a very bright multi-colored image. Again, is there some type of linear stretch or correction that I should apply to the images to see better results?
Thank you so much ahead of time for your help. If you can answer any of these questions or give any beginner advice I would greatly appreciate it!
CRISM_workshop_2012_walk_thru_KDS_DLB.pdf


")