Ralph Vidal
-
Posts
8 -
Joined
-
Last visited
Content Type
Profiles
Forums
Downloads
Blogs
Everything posted by Ralph Vidal
-
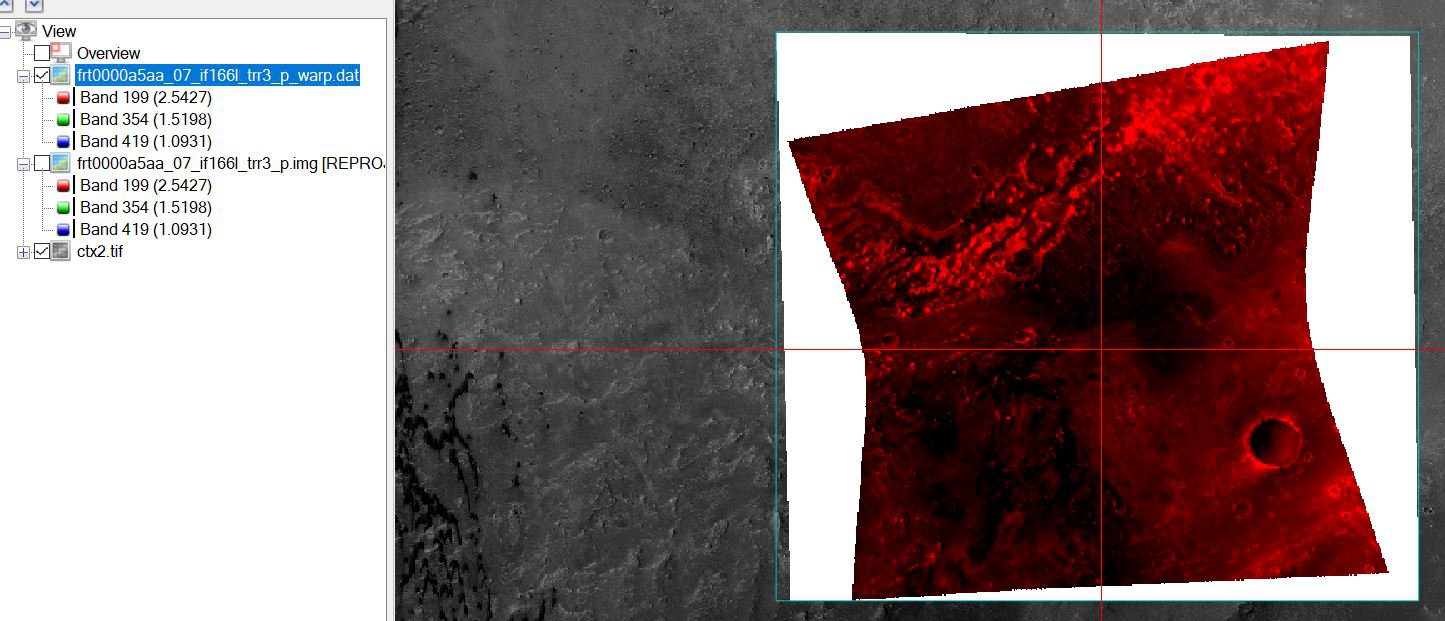
hi Feng, I managed to correct the image as you explained. But when I set the ignore value to 65535 it seems to keep a black stripe on one side that I cannot get rid of ( see attachments ) . When I set the ignore value to 0, the black stripe disappears but a white background appears. There is some kind of white line around the picture too. Do you maybe have any hints how to fix this ? Thanks Ralph

-
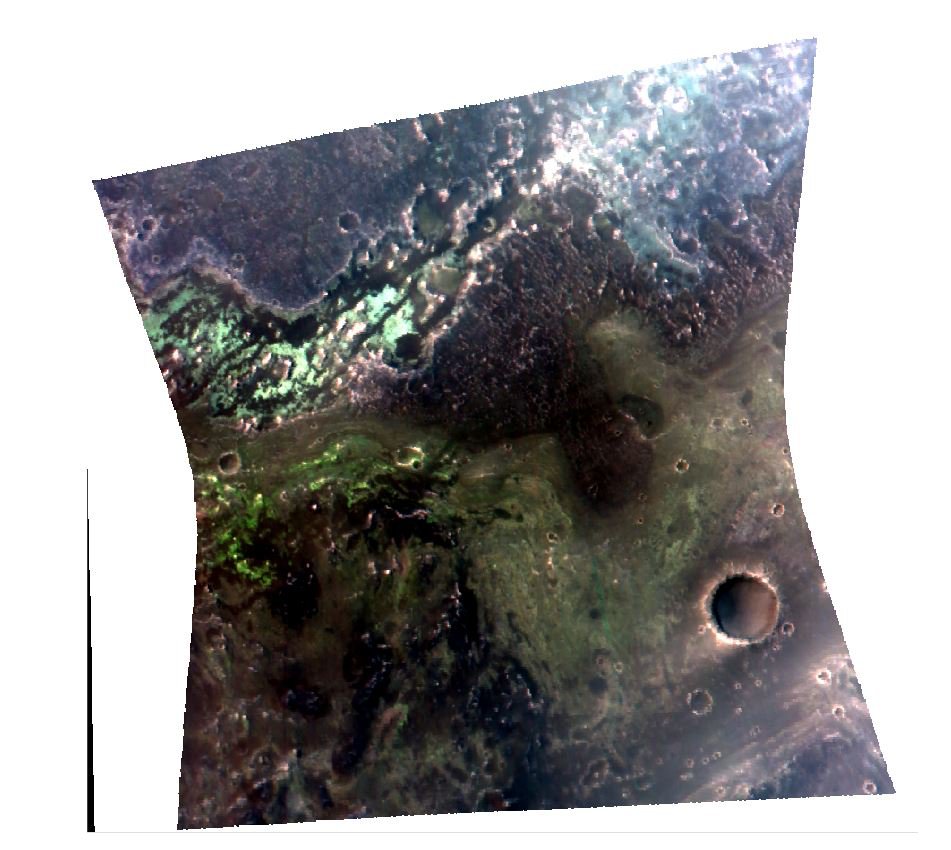
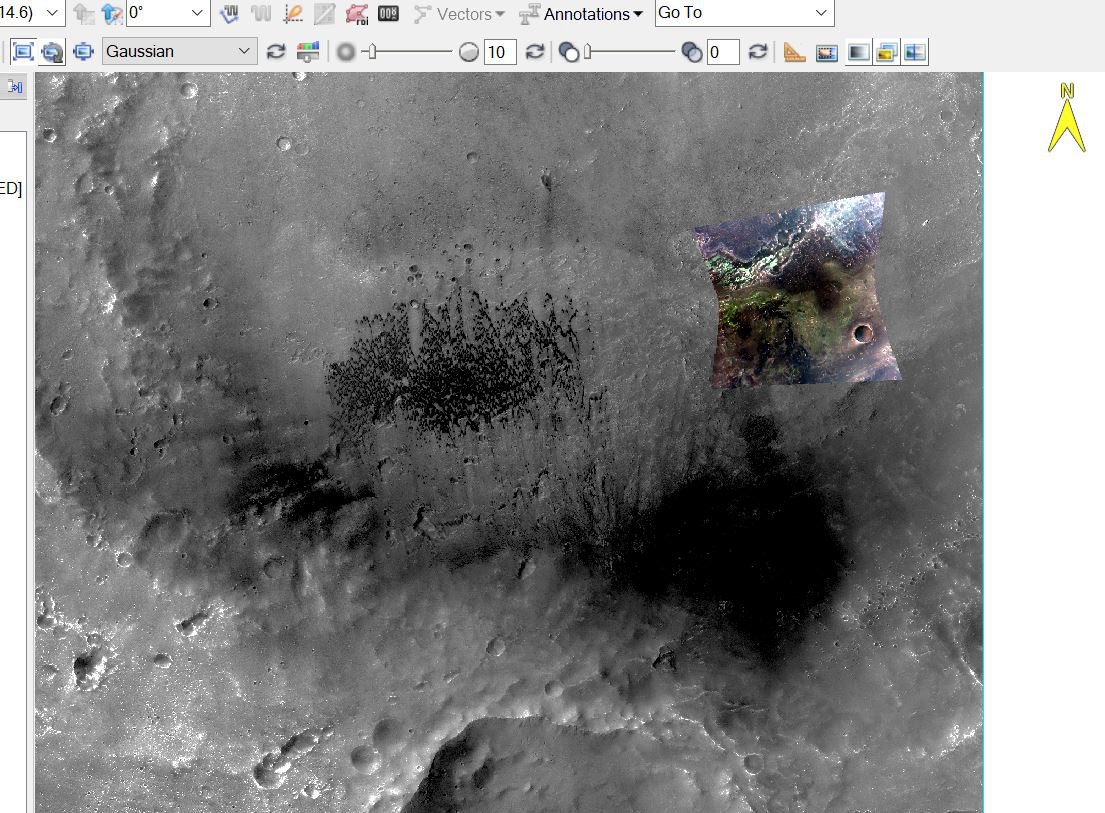
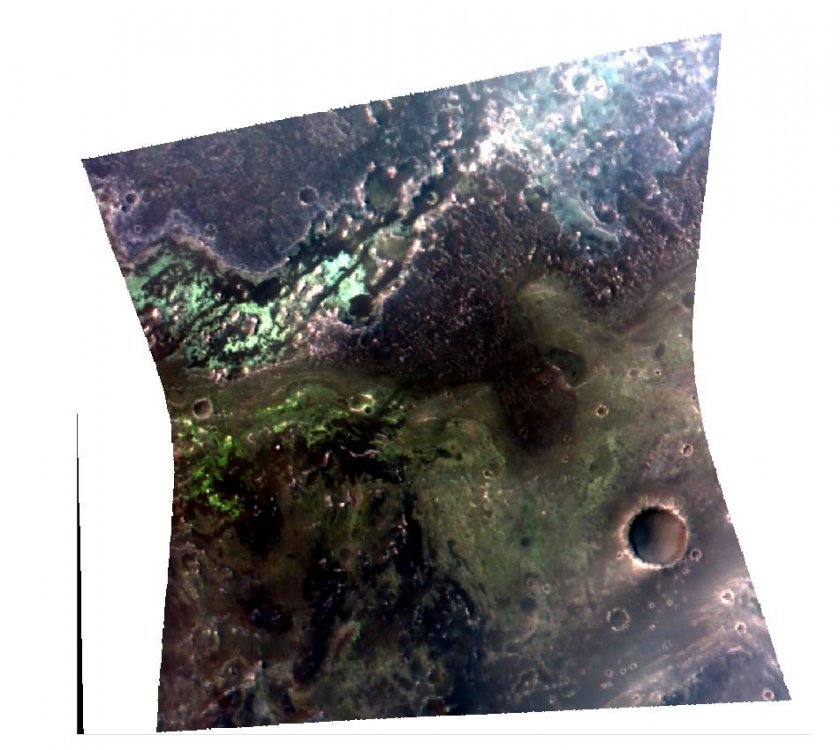
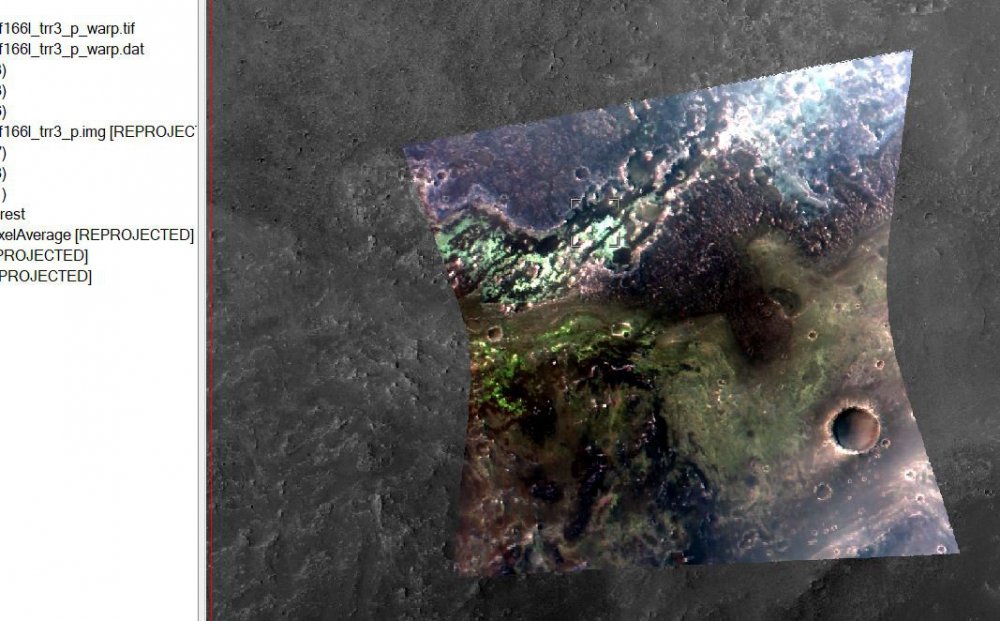
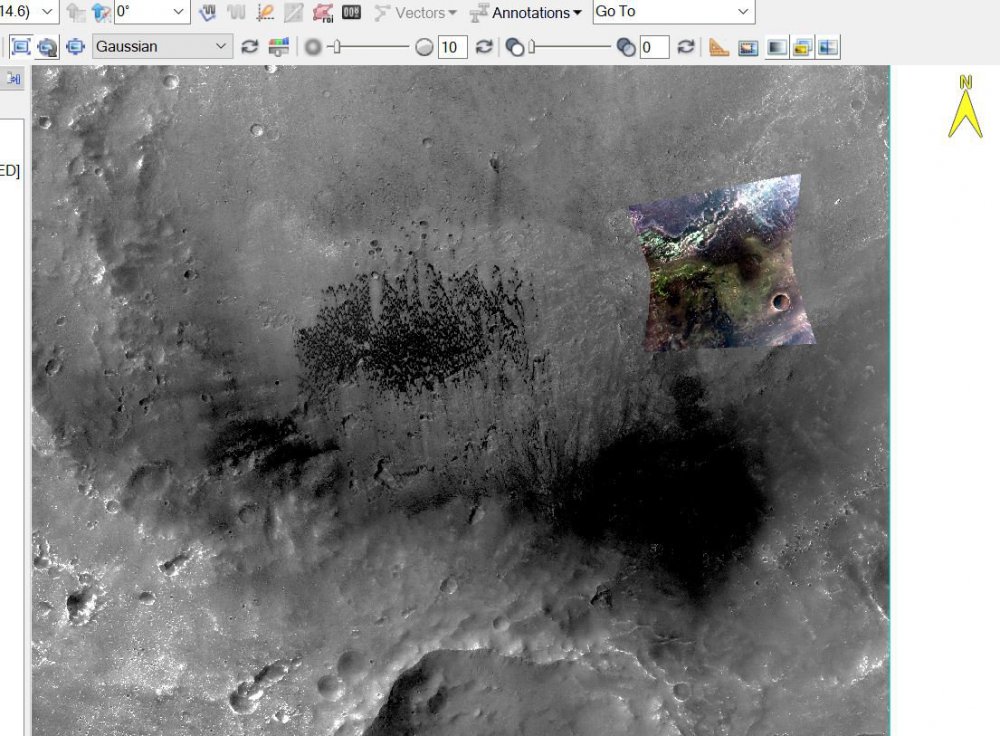
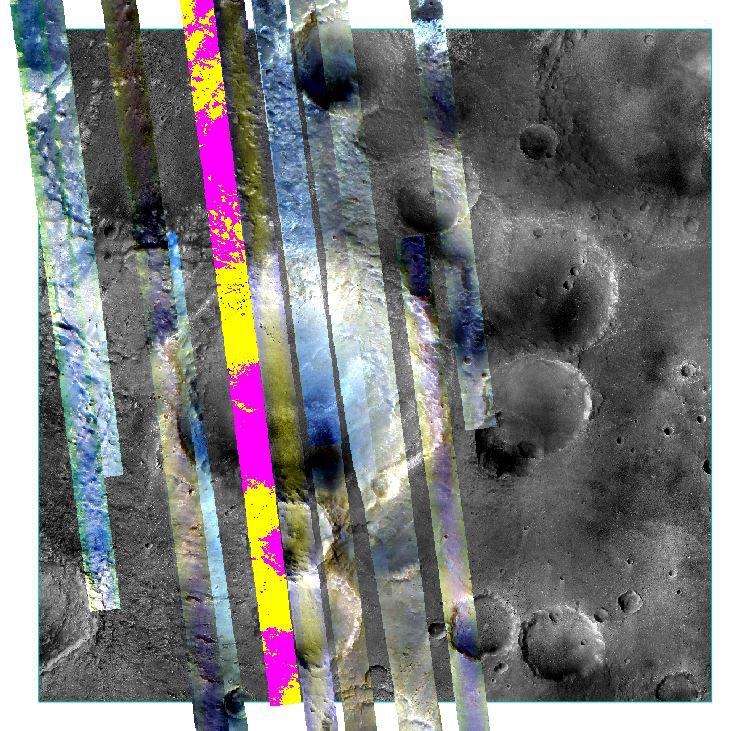
Hi Feng, the geo-referencing works now , I did the images co-registering as you explained. The reprojected image is on the right place, but it seems to have an issue with the bands : usually the false color RGB should be bands 199, 354 and 419. It shows strange results though ( image is red ,see pics ) thanks Ralph

-
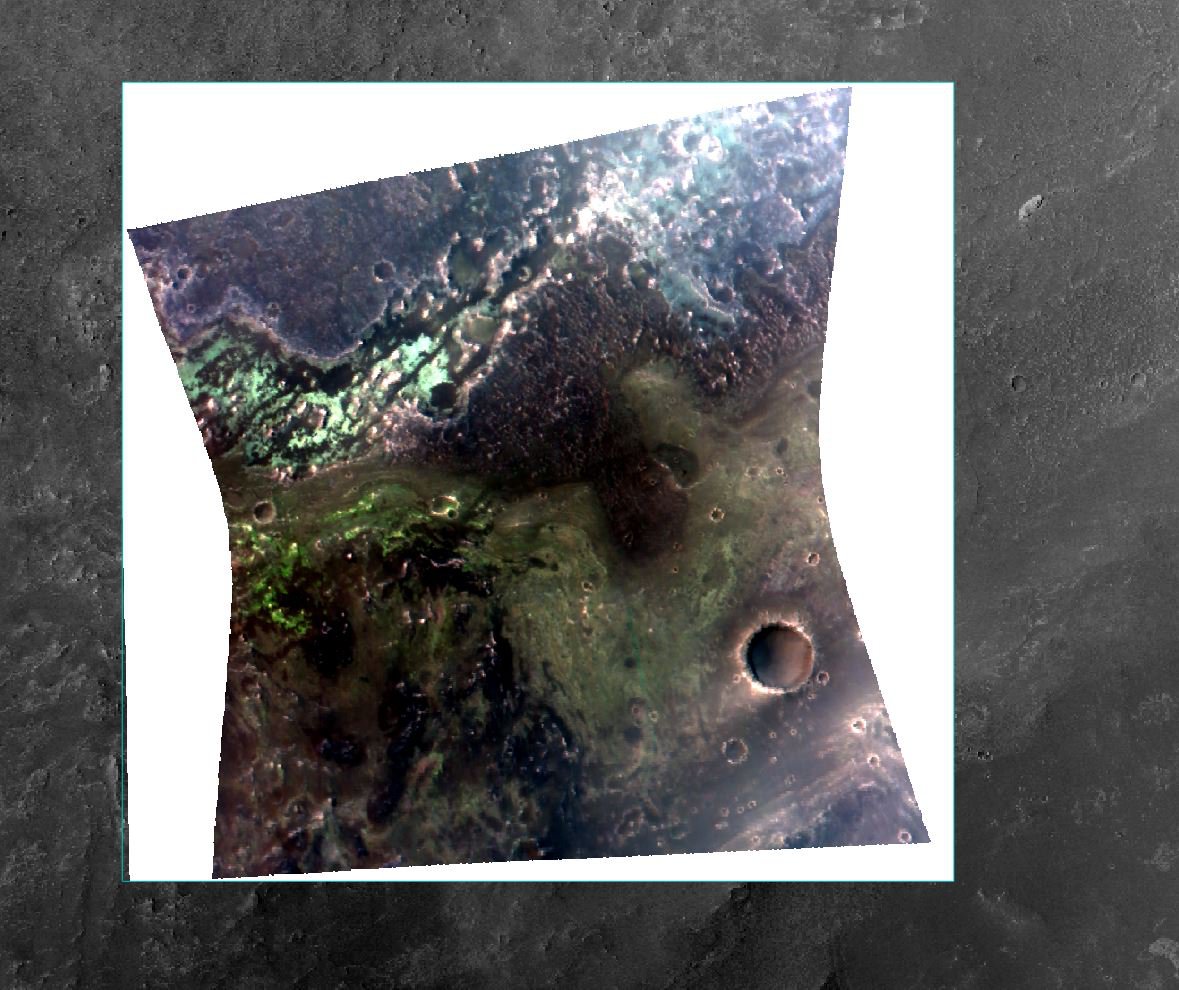
Hi Feng, thanks, I copied the files to the envi directory. The error message is gone. Anyway the images still do not fit. 1) CTX image: Data http://murray-lab.caltech.edu/CTX/tiles/beta01/E-024/Murray-Lab_CTX-Mosaic_beta01_E-024_N20_data.zip Thumbnail http://murray-lab.caltech.edu/CTX/tiles/beta01/E-024/Murray-Lab_CTX-Mosaic_beta01_E-024_N20_thumb.png 2) CRISM image ( unprojected) : frt0000a5aa_07_if166l_trr3 http://themis-data.asu.edu/viewer/crism#P=FRT0000A5AA_07_IF166L_TRR3&T=2 ( all links to download to ddr1 and img files on the page ) Could the problem lie with the CTX image projection settings ? Thanks Ralph
-
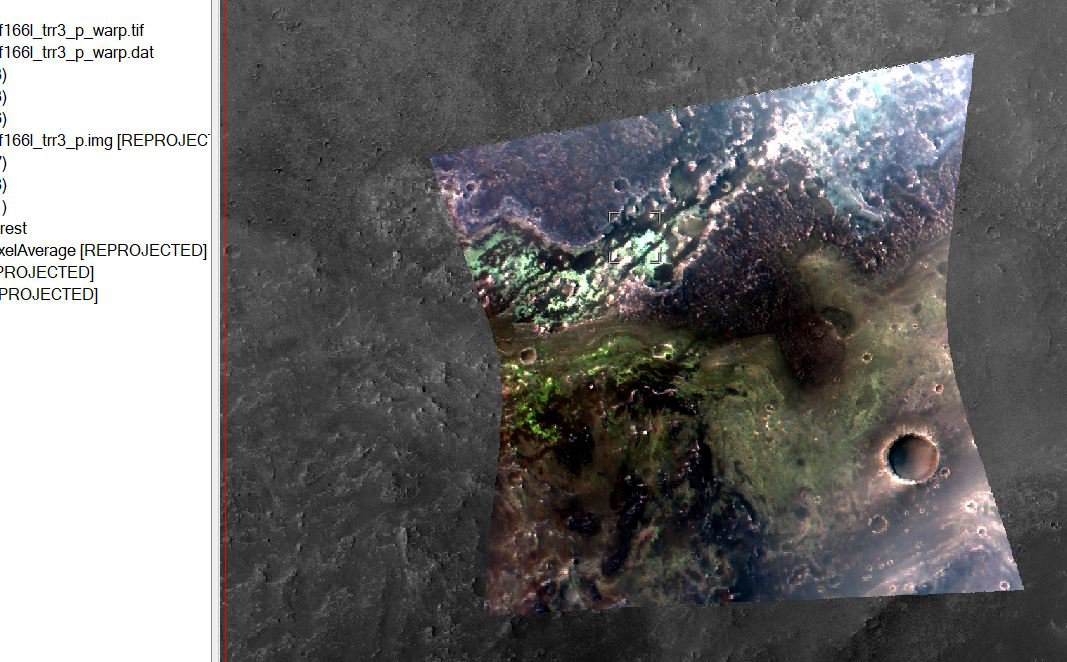
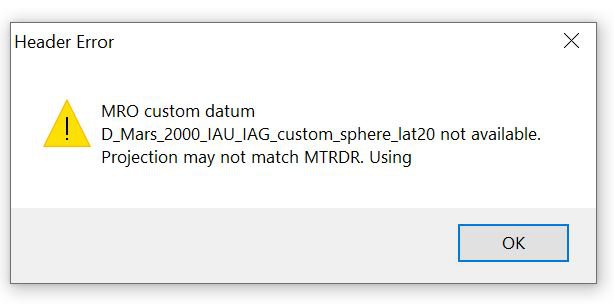
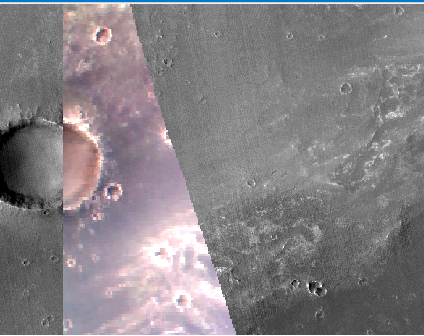
Hi guys, I am using the CAT tool (latest version, 4/8/20) to map project crism data, I am not getting it right, when I overlay the projected data on a CTX image they do not quite fit. When projecting the crism tr3 image using CAT I get error message shown in the first picture. The CAT instruction at https://astropedia.astrogeology.usgs.gov/download/Docs/PlanetaryDataWorkshop/Presentations2017/Monday/Humphreys/Morgan_CATupdates.pdf tells that " Where do I get those definitions ? Is there some .proj file I have to put into the envi folder/ CAT folder ? The third picture shows the swipe made with a crism image overlain on the CTX image. Latitude seems to fit, longitude does not.. Thanks Ralph

-
Hi, I read in a CRISM doc that following: Is there a table/document where such minimum/maximum values can be found, or is it image dependent and has to be found individually each time ?
-
Processing CRISM data with ENVI: which steps ?
Ralph Vidal replied to Ralph Vidal's topic in For data users
Hi Ray, yes, I got the CAT 7.4 from your website and installed it on ENVI 5.5.3 ( CAT does not appear on the menu when using envi classic, but it does not matter, as I am not using the classic gui ). I am working with the S data because there is not enough L data for this crater . Where L data is available , I will use it , otherwise I have use the S data . It seems the CAT tool would only identify ferric phases, that is why I am trying to use ENVI's spectral angle mapping tool with the "rocks.sli" library. The CRISM data files I get from http://themis-data.asu.edu/ ( for example http://themis-data.asu.edu/viewer/crism#P=FRT0000A5AA_07_IF166L_TRR3&T=2 ) - not the processed ones , but the ones with the link on the page ( ddr1, lbl, .img etc) Ralph -
Processing CRISM data with ENVI: which steps ?
Ralph Vidal replied to Ralph Vidal's topic in For data users
Hi Ray, I finally managed to install ENVI 5.5.3 on my computer. As I wrote before , I intend to use VNIR crism data with the "rocks.sli" spectral library. The first picture ( crism VNIR images overlain on CTX mosaic ) shows the area I want to process . The second pic shows the results using SAM with Bandmax ( threshold of 0.05) applied to one of the VNIR images. Does it make sense ( using only VNIR data with CRISM's "rocks.sli" library ) ? Thanks Ralph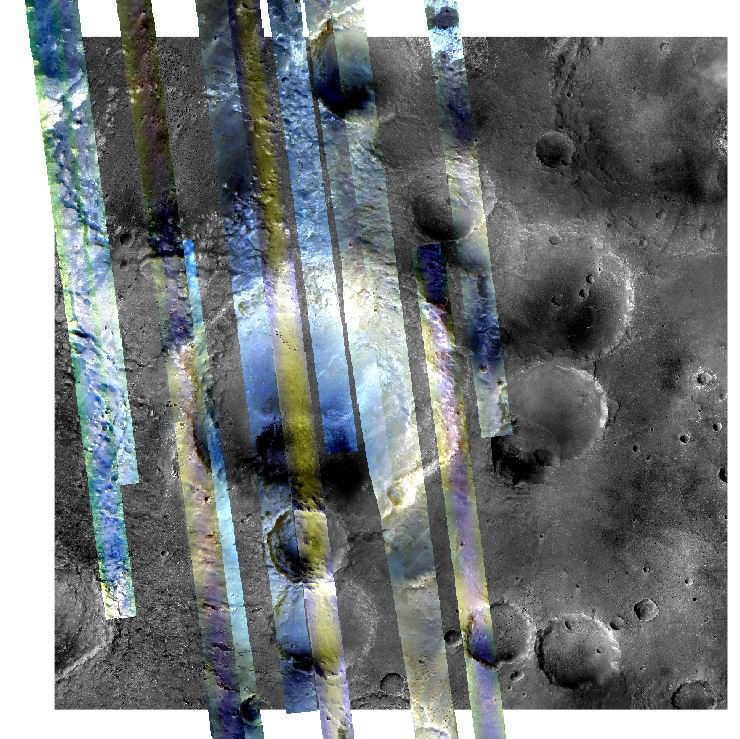
-
Hi, I am working with CRISM data on the McLaughlin Crater . I have downloaded following IR dataset images FRT0000CB488_07_IF166L_TRR3 FRT000139F7_07_IF166L_TRR3 FRT000247A0_07_IF166L_TRR3 HRS00006AC4_07_IF175L_TRR3 FRS00029E22_01_IF168L_TRR3 FRS0002B4DA_01_IF168L_TRR3 FRS0002C9DC_01_IF168L_TRR3 FRS0002DB50_01_IF168L_TRR3 FRS0002EF79_01_IF168L_TRR3 FRS0002FF3C_01_IF168L_TRR3 FRS0003134A_01_IF168L_TRR3 FRS00035729_01_IF168L_TRR3 FRS0003640C_01_IF168L_TRR3 FRS0003705A_01_IF168L_TRR3 FRT00009CAE_07_IF166L_TRR3 FRT0000A27C_07_IF166L_TRR3 FRT0000A5AA_07_IF166L_TRR3 FRT0000C42E_07_IF166L_TRR3 FRT0000C6AF_07_IF166L_TRR3 as well as those VNIR images: hsv0001bf65_01_if209s_trr3 hsv0001e87c_01_if209s_trr3 hsv0002e57c_01_if209s_trr3 hsv0003f9e0_01_if209s_trr3 hsv00043b25_07_if209s_trr3 hsv000293cf_01_if209s_trr3 hsv000412d4_03_if209s_trr3 hsv000478c2_03_if209s_trr3 hsv0002003a_01_if209s_trr3 hsv0002246d_03_if209s_trr3 hsv0003793e_01_if209s_trr3 What would be the steps needed to process those images? As far as I understood I need to 1) Convert PDS to CAT ( is it needed ? ) before loading image into Envi 1) ATM correction ( for VNIR images only photometric correction) 2) CIRRUS ( despike + destripe) 3) MRO CRISM remove stripes 4) Flatten summary products ( what does it do ? is it necessary ? ) 5) Apply crism bad band list Are the above steps correct/enough/in the correct order , and is there a script ( IDL whatever ) to process thos images as a batch task ? I am doing a geological map of the McLaughlin crater, using crism's "rock.sli" spectral library to map the geological units. Can this library be used with VNIR data, or only with IR data ? Thanks Ralph Vidal