

Tom Stein
-
Posts
49 -
Joined
-
Last visited
Content Type
Profiles
Forums
Downloads
Blogs
Posts posted by Tom Stein
-
-
Hi jomynn -
Would you please post an example that you'd like to see worked through? A specific image, perhaps?
-
Data and documentation from Mars InSight lander acquired through 30 June 2022 are released. Some data may still be loading into the Notebook; see Data release status for details. Some instrument teams may include additional and/or reprocessed data in their archive deliveries to PDS. Refer to instrument errata and readme documents for details, or contact us with questions.
-
Data and documentation from Mars 2020 Perseverance rover sols 300 to 419 are released. Some data may still be loading; see Data release status for details. Some instrument teams may include additional and/or reprocessed data in their archive deliveries to PDS. Refer to instrument errata and readme documents for details, or contact us with questions.
-
The Phoenix Analyst's Notebook has been updated with new information and access tools. New features include mission summaries like the mission overview and time tables; faceted data search; science targets with Mars Target Encyclopedia literature references; data set DOIs; optional user accounts; and cart-based data ordering. The previous version of the Phoenix Notebook remains available.
-
The above video demonstrates how to order data from the Analyst's Notebook using search filters and the cart order system. The transcript of the video is provided below.
QuoteHello. I am going to provide a short video demonstrating getting data from the Mars Curiosity rover using the Analyst’s Notebook.
In this case, I want to download Navcam image data from a particular sol using a pattern for the data product ID.
I will start by signing into to the Notebook. An account is not required but is useful for return visits to the site.
Let me minimize this introductory help window.
For this demonstration, our goal is to find Navcam data from a specific sol using product ID pattern matching. Let’s click on the search tab, and then select data search.
Now we will set some filters.
- We want data from sol 611, so I will enter 611 as the start sol and click tab. I also will set the end sol. Notice that the results have changed to reflect this setting.
- Let’s constrain search results to only Navcam data.
- And then let’s scroll to the bottom to add our product ID pattern. In this case, we are looking for linearized RAD data with a specific sequence value.
Notice the prompt at the top of the results listing. The suggestion is that we change the Results view setting to “all products” based on our use of the ID filter. Let me scroll the filter list to the top where we see that currently the Results view is set to “Observation groups”. We will accept the suggested change, and now we have 10 data products in the results view.
As a side note, we can read more about the Results view filter using the help options provided. More information is available in this help window.
Now that we have found the data that matches our settings, we will add them to our cart.
Let’s now go to our cart to finish the order and download the data. The cart is found in the User tab. We will click on View cart and checkout.
I will accept the current Order settings and continue to step 2 of the checkout.
The settings here show that I will receive an email when a zip file is ready for download. I will click Submit Request and look forward to the email message that will arrive shortly. The message will include a link to a zip file with the data we ordered.
If you have questions about using the Notebook, you can switch to the Help tab to access the online documentation and to get information about contacting us directly.
-
Data and documentation from Mars InSight lander acquired through 31 December 2021 are released. Some data may still be loading into the Notebook; see Data release status for details. Some instrument teams may include additional and/or reprocessed data in their archive deliveries to PDS. Refer to instrument errata and readme documents for details, or contact us with questions.
-
Data and documentation from Mars 2020 Perseverance rover sols 180 to 299 are released. Some data may still be loading; see Data release status for details. Some instrument teams may include additional and/or reprocessed data in their archive deliveries to PDS. Refer to instrument errata and readme documents for details, or contact us with questions.
-
Data and documentation from MSL Curiosity rover sols 3193 tp 3289 are released. Some data may still be processing. See Data release status for details. Some instrument teams may include additional and/or reprocessed data in their archive deliveries to PDS. Refer to instrument errata and readme documents for details, or contact us with questions.
-
The Notebook is the only resource for these documents. You might find similar sites with mission logs hosted by various instrument teams.
-
Great question. The sol documents you refer to are the Mission Manager and Documentarian reports that provide a view into science operations—insight into why and how particular observations were made. The reports have not been edited except for grammar and spelling, and to remove spacecraft and instrument sensitive materials.
As you note, the sol documents are not part of the formal science archive. They are provided courtesy of the respective mission science teams who approve the content. Separate from the sol documents are mission and data set documents that are collected from archive bundles and volumes and are designed to promote understanding off the mission, spacecraft, instruments, and data formats.
I have updated the online help to include a more detailed description of sol documents, highlighting the fact that they are not part of the formal archive.
-
Data and documentation from MSL Curiosity rover sols 3069 to 3192 are released. Some data may still be processing. See Data release status for details. Some instrument teams may include additional and/or reprocessed data in their archive deliveries to PDS. Refer to instrument errata and readme documents for details, or contact us with questions.
-
The Image viewer tool has an updated drawing library. Users should notice improvement in text annotation quality and general responsiveness. See Image viewer for more about the tool.
-
The Mars 2020 Analyst's Notebook for Perseverance Rover is released in beta version and is available to the public. The Notebook includes data and documentation from PDS releases 1 and 2, containing data from sols 0 to 179.
Known limitations for the beta version are described in the online help.
-
Hi Neal -
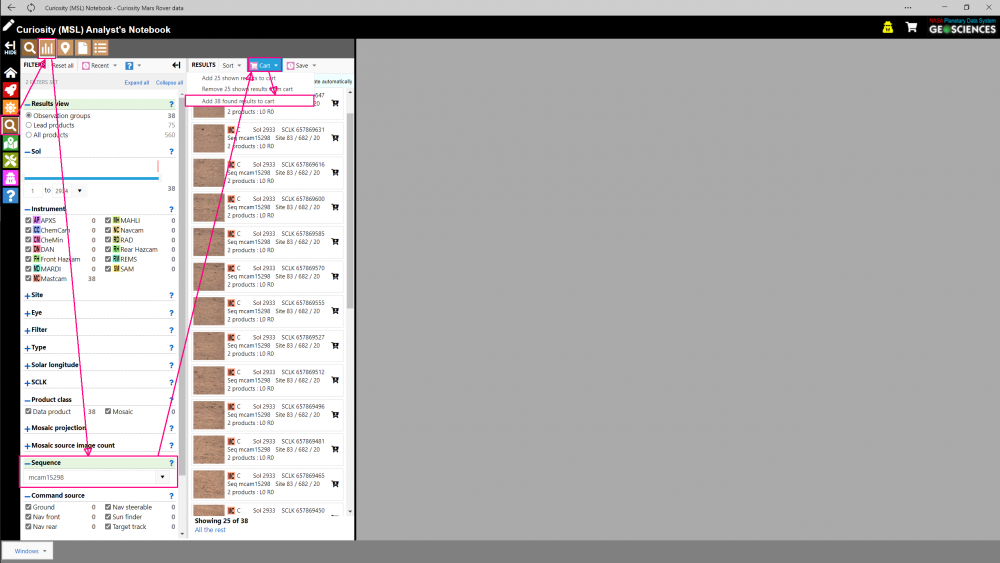
Your question makes perfect sense. In the data search, you can enter a sequence ID as a search criterion. The available sequences will appear as you type, so by entering "15298", for example, the selection box provides the correct sequence ID "mcam15298". Search results will appear on the right side where you can add the found items to your cart from the menu. See the attached image as an example.
You can apply other search criteria as you wish. The default results for MastCam will be DRCX products. If you are looking for XXXX products, try this trick: select "All products" from the "Results view" option at the top of the filter list, and then enter "*XXXX" in the "ID" option at the bottom of the filters. You can further restrict the selection to omit thumbnails by selecting "C" Mastcam data type under the "Type" filter option.
Tom
-
The Analyst's Notebook has been updated with data from release 5, containing data from sols 391 to 478 for the InSight lander.
-
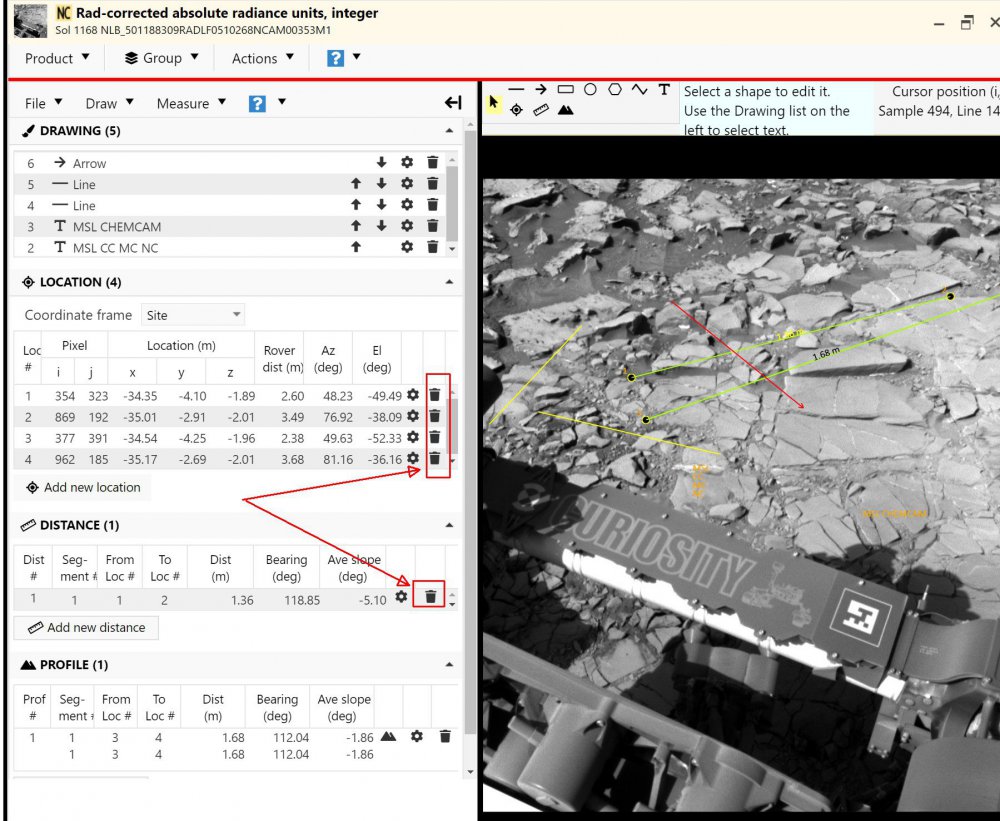
Hi, Jimmy. You should be able to delete individual measurements and other elements by clicking on the corresponding trash can icon in the list of elements to the left of the image. See the image below for an example. Note that deleting one annotation may delete others as well. For example, if you delete a location that is the endpoint of a distance measurement, the endpoint locations and the distance measurement all will be deleted. You will receive a warning in such cases asking you to confirm the delete. Please let us know if you still feel that the tool isn't working the way you expect.
I am glad that you find the measurement tools useful. You are welcome to make suggestions for tool enhancements.
-
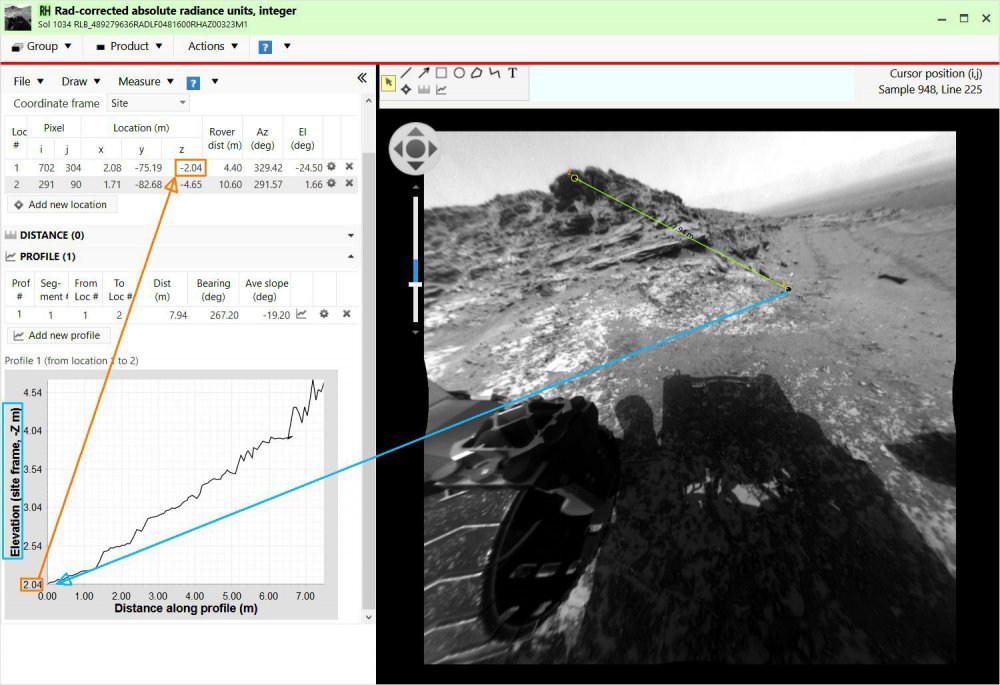
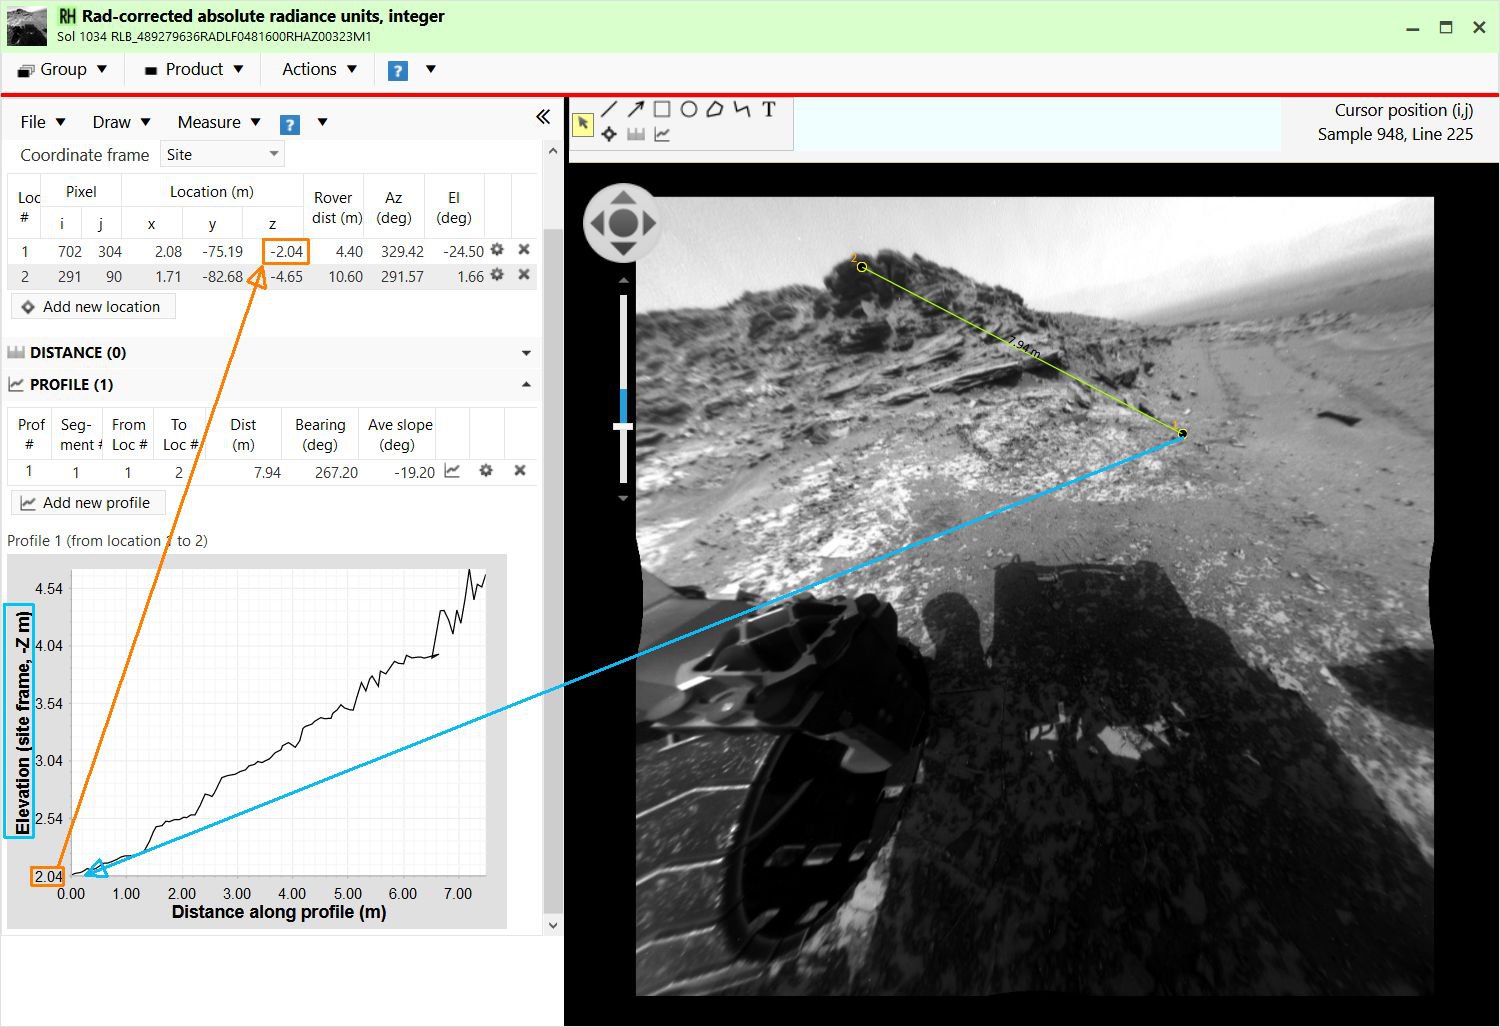
The profile plot y -axis is elevation in site frame. To be specific, the elevation values shown are the rover's negative z-axis values because in site frame, the rover's z-axis is positive down. You will notice in the attached example, the elevation of the first point is z = -2.04m in the location list and 2.04m in the profile plot. (Remember, the profile shows elevation as -z values.) If you change the Coordinate frame from Site to Rover using the drop down menu, you will see different z values in the location list.
The profile plot x-axis is distance along the profile, with the first point in the plot being the beginning of the profile drawn on the image. This means that, although the plotted elevation is absolute using site frame values, the distance along the profile is relative to the points selected.
Note that the profile calculated returns the elevations along a path as if it were "dropped on the ground" between the two points. The profile is not simply the elevation values of the image pixels under the line drawn on the image.
-
Hi Jimmy - thanks for dropping the note. We're sorry for the inconvenience.
I tracked down the problem to an integer conversion and the fix is in place. You probably will need to refresh your browser window. Please let me know how it goes.
-
Glad to hear!
-
You are correct, Jimmy. The Mastcam L/R have different fields of view which can make working with the stereo pairs more difficult. The Notebook uses Navcam XYZ data products generated by the team to support the measurement and distance tools. However, the Mastcam team does not produce XYZ data products, thus the Notebook measurement tools can't support Mastcam images taken as stereo pairs.
-
You can use GDAL to convert the IMG file to a number of formats. I used v2.4. Be sure to use the PDS label (.LBL) file as the input to gdal_translate:
gdal_translate -of GTiff 1627MR0083990000801607K00_DRCX.LBL .\1627MR0083990000801607K00_DRCX.tifGDAL is available at http://www.gdal.org/ and you can read more about the gdal_translate command at http://www.gdal.org/gdal_translate.html
-
You can find the raw image archives at the PDS Cartography and Imaging Sciences Node: https://pds-imaging.jpl.nasa.gov/volumes/msl.html
-
The sol 1627 sequence does have 112 thumbnail video frames (product type "K"). Unfortunately, the command sequence did not include a request for full-resolution frames to match. Note that the 10 K-type products you see for sol 1627 are really the two "XXXX" images and the eight derived images (four from each) that include a variety of color correction, linearization, and other techniques applied. The four Mastcam derived image types (also called processing codes) are DRXX, DRCV, DRLX, and DRCL. You can read about them in the data product SIS (Software Interface Specification). In the Notebook, click on the Resource tab, then choose "View documents". Select Mastcam and scroll down to the document titled "MSL_MMM_EDR_RDR_DPSIS.PDF".
Only a handful of sols have full-resolution (or higher-resolution) Mastcam movie sequences. Through the current data release, the sols are:
- Type K, sols 351, 363, 368, 713, 1032, 1627, 1668, 1692, 1693, 1972
- Type L, sols 363, 368, 369, 650, 713, 1032
- Type M, sols 284, 284, 289, 351, 1625
The K-type sequences generally have the fewest frames per sequence. Some sols have multiple sequences.
You can find the images in the Notebook from the Search > Data form. Enter the sol, instrument, and product type, and also put the processing code "DRCX" in the Product ID box. This will restrict the number of images that are returned.
PS. Nice video. I'd like to see what you get from higher-res images.
-
Glad to hear the tutorial helped. Although not trivial, you can use the Mastcam SIS (Software Interface Specification) in conjunction with individual product labels to work out the pointing information. The scale is a bit tougher. We are working on adding image footprints to the traverse map to show orientation. We will also consider adding pointing information to the product overview page to at least provide basic information about where the image is relative to the rover.
The Mastcam SIS is available here: http://an.rsl.wustl.edu/su/t8F4Tcw3
Note that this link may change as documents are updated. I found the document from the Resources tab under "Mission and instrument data set documents" and then choosing "Mastcam".


Mars 2020 Perseverance Rover RIMFAX data
in For data users
Posted
A direct message with this question was answered earlier today. Here is the response, made available to others who might have the same question.